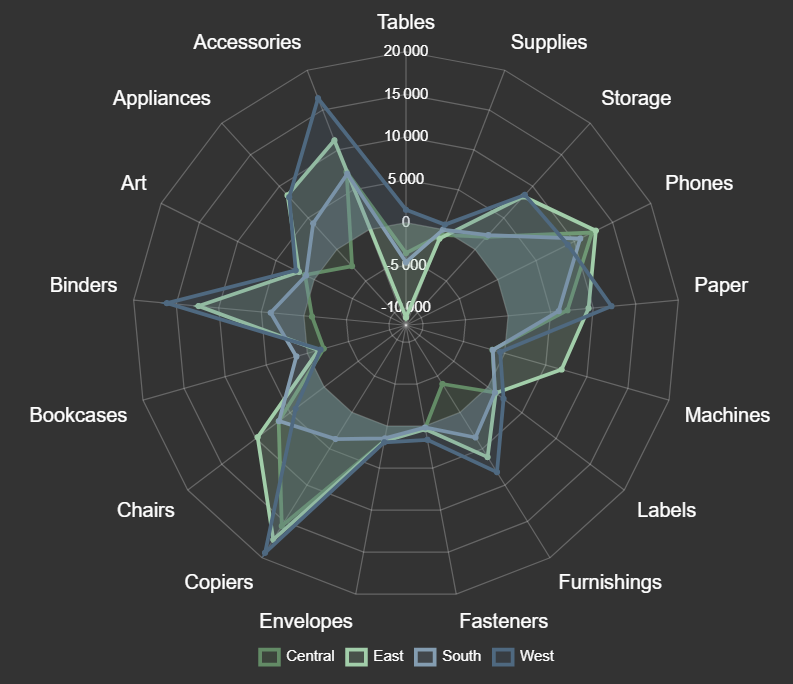
Radar
Visualize data in a circular layout
Show relationships between different data points
Ideal for displaying multi-dimensional data
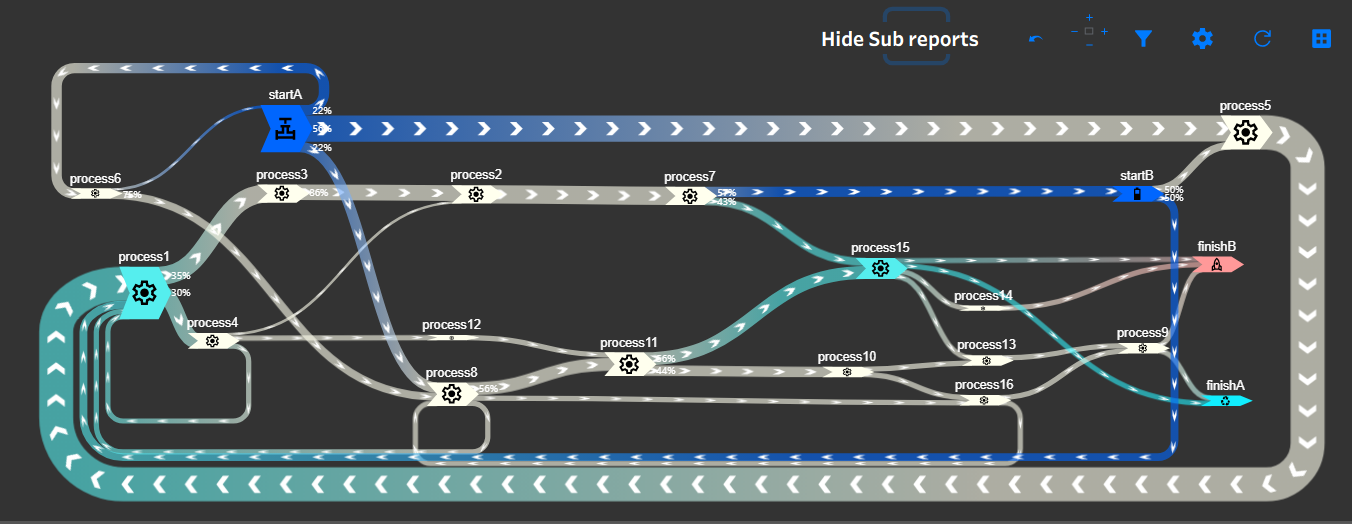
Circular Sankey
Illustrate flow and displays cycles within a system
Show proportions of flow between different nodes
Ideal for displaying energy, material, or cost transfers
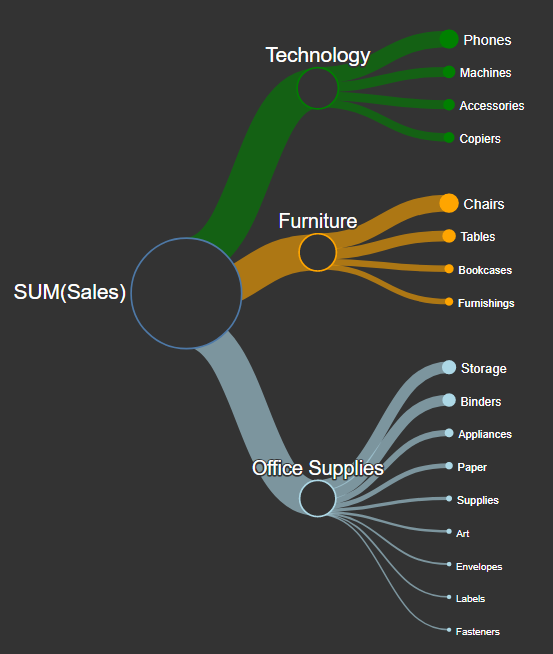
Tree
Visualize hierarchical data structures
Show parent-child relationships
Ideal for displaying tree-like data
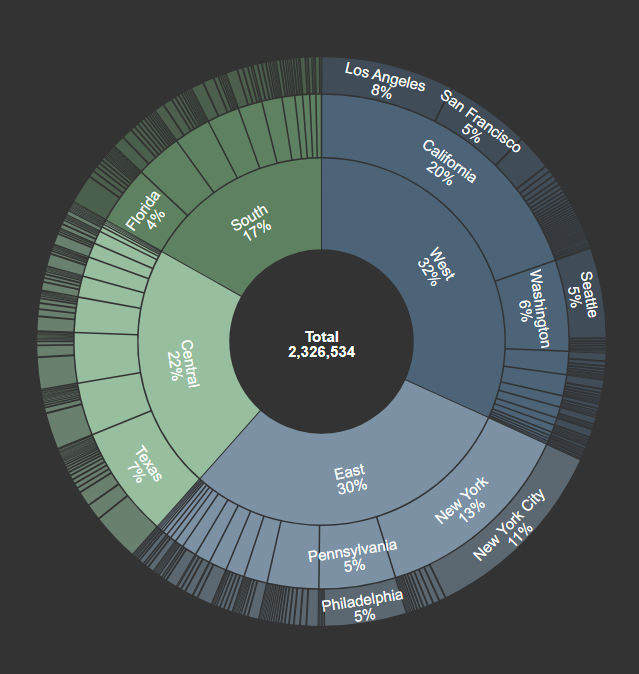
Sunburst
Visualize hierarchical data in a radial layout
Show proportions of categories within a whole
Ideal for displaying multi-level data
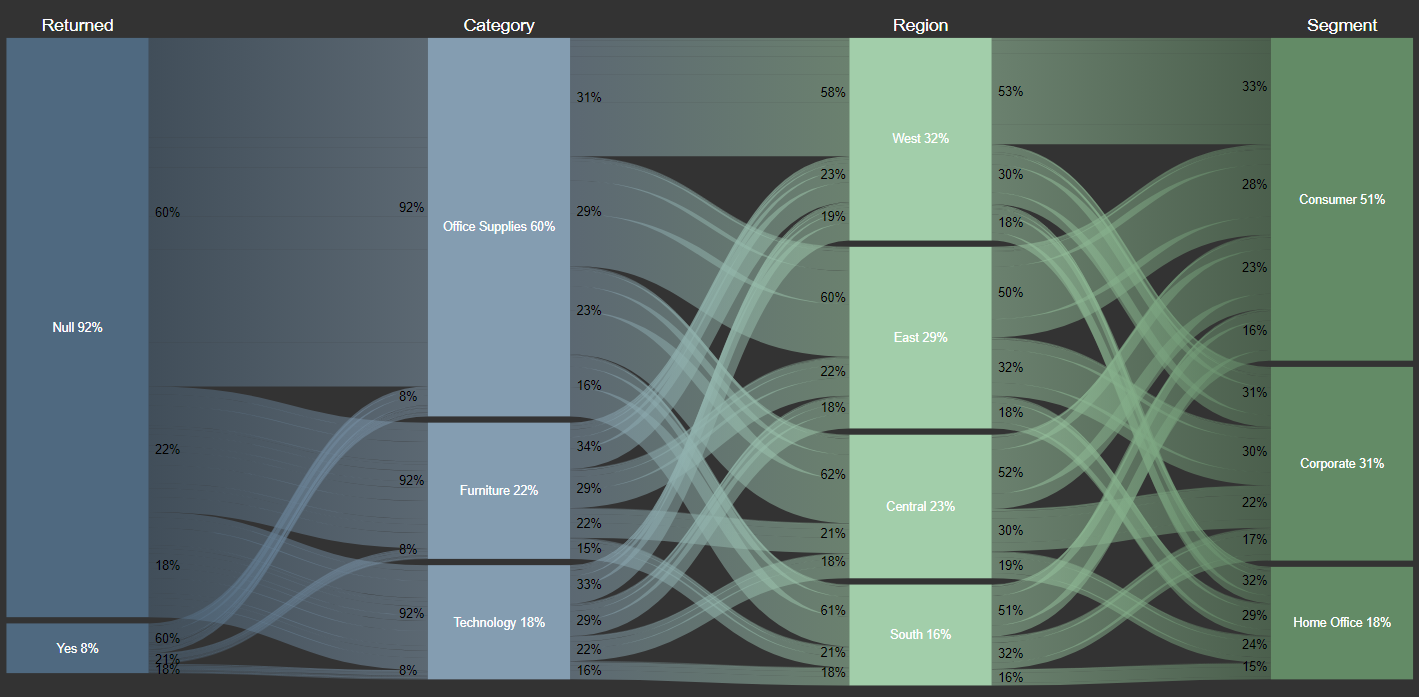
Sankey
Illustrate flow and connections between entities
Show proportions of flow between different nodes
Ideal for displaying energy, material, or cost transfers