Lunch break, plotting traffic injuries with datashader
Well I love the datashader Python package and I am always happy to use it on some interesting datasets. I recently came across a traffic injury database for french roads, which happens to have some geographical coordinates. This comes from the open platform for french public data. So in this notebook, we are going to plot all the georeferenced collisions that ocurred over 13 years in mainland France.
Disclaimer: this notebook was written during lunch break (Q&D style).
Imports
import subprocess

import pandas as pd
import datashader as ds
from datashader import transfer_functions as tf
from colorcet import palette
import matplotlib
import matplotlib.pyplot as plt
plt.style.use('seaborn')
%load_ext watermark
%watermark -v
CPython 3.8.1
IPython 7.11.1
%watermark --iversions
matplotlib 3.1.2
pandas     1.0.0
datashader 0.10.0
Collect the CSV files
The coordinates can be found in the caracteristiques_20??.csv files. I did not try to scrap the web page but just gathered the urls for each year into a list:
files = [
    ['https://www.data.gouv.fr/fr/datasets/r/6eee0852-cbd7-447e-bd70-37c433029405', 2018],
    ['https://www.data.gouv.fr/fr/datasets/r/9a7d408b-dd72-4959-ae7d-c854ec505354', 2017],
    ['https://www.data.gouv.fr/fr/datasets/r/96aadc9f-0b55-4e9a-a70e-c627ed97e6f7', 2016],
    ['https://www.data.gouv.fr/fr/datasets/r/185fbdc7-d4c5-4522-888e-ac9550718f71', 2015],
    ['https://www.data.gouv.fr/fr/datasets/r/85dfe8c6-589f-4e76-8a07-9f59e49ec10d', 2014],
    ['https://www.data.gouv.fr/fr/datasets/r/18b1a57a-57bf-4bf1-b9ee-dfa5a3154225', 2013],
    ['https://www.data.gouv.fr/fr/datasets/r/b2518ec1-6529-47bc-9d55-40e2effeb0e7', 2012],
    ['https://www.data.gouv.fr/fr/datasets/r/37991267-8a15-4a9d-9b1c-ff3e6bea3625', 2011],
    ['https://www.data.gouv.fr/fr/datasets/r/decdfe8c-38ff-4a06-b7fc-615785f2914d', 2010],
    ['https://www.data.gouv.fr/fr/datasets/r/fdfacdb9-f48e-4759-bae5-48d063216acb', 2009],
    ['https://www.data.gouv.fr/fr/datasets/r/722ebb99-c8b2-4635-bf8d-125dd280ee42', 2008],
    ['https://www.data.gouv.fr/fr/datasets/r/6fc7b169-4dfe-442c-8c28-8bd773aeddf8', 2007],
    ['https://www.data.gouv.fr/fr/datasets/r/fafa33cf-50cb-4092-a819-d5209f684089', 2006],
    ['https://www.data.gouv.fr/fr/datasets/r/a47866f7-ece1-4de8-8d31-3a1b4f477e08', 2005],
]
Let’s download these files:
%%time
file_paths = []
for item in files:
    file_path = f'./data/caracteristiques-{str(item[1])}.csv'
    file_paths.append(file_path)
    cmd = f'wget --output-document {file_path} {item[0]}'
    subprocess.call(cmd, shell=True)
CPU times: user 322 µs, sys: 100 ms, total: 100 ms
Wall time: 20.4 s
Load the CSVs into a dataframe
If we look at the encoding of each file, we get a little surprise:
for file_path in file_paths:
    cmd = f'uchardet {file_path}'
    encoding = subprocess.check_output(cmd, shell=True).decode("utf-8")[:-1]
    print(encoding)
ISO-8859-1
ISO-8859-1
ISO-8859-1
ISO-8859-1
ISO-8859-1
ISO-8859-1
ISO-8859-1
ISO-8859-1
ISO-8859-1
UTF-8
WINDOWS-1252
WINDOWS-1252
WINDOWS-1252
WINDOWS-1252
Also, the separator may vary, and is not always detected by pandas (csv.Sniffer?), so the seperator is hard-coded for each file. Fortunately, all the loaded dataframes have the same column names, so we concantenate them all:
df = pd.DataFrame()
for file_path in file_paths:
    cmd = f'uchardet {file_path}'
    encoding = subprocess.check_output(cmd, shell=True).decode("utf-8")[:-1]
    if file_path.split('-')[-1].split('.')[0] == '2009':
        sep= '\t'
    else:
        sep = ','
    df = pd.concat([df, pd.read_csv(file_path, encoding=encoding, sep=sep)], axis=0)
df.info()
<class 'pandas.core.frame.DataFrame'>
Int64Index: 958469 entries, 0 to 87025
Data columns (total 16 columns):
 #   Column   Non-Null Count   Dtype
---  ------   --------------   -----
 0   Num_Acc  958469 non-null  int64
 1   an       958469 non-null  int64
 2   mois     958469 non-null  int64
 3   jour     958469 non-null  int64
 4   hrmn     958469 non-null  int64
 5   lum      958469 non-null  int64
 6   agg      958469 non-null  int64
 7   int      958469 non-null  int64
 8   atm      958396 non-null  float64
 9   col      958450 non-null  float64
 10  com      958467 non-null  float64
 11  adr      816550 non-null  object
 12  gps      480052 non-null  object
 13  lat      471401 non-null  float64
 14  long     471397 non-null  object
 15  dep      958469 non-null  int64
dtypes: float64(4), int64(9), object(3)
memory usage: 124.3+ MB
Now we create a datetime index:
df.rename(columns={'an': 'year', 'mois': 'month', 'jour': 'day'}, inplace=True)
df.year = df.year.map(lambda x: int('20' + str(x).zfill(2)))
df['hour'] = df.hrmn.map(lambda x: int(str(x).zfill(4)[0:2]))
df['minute'] = df.hrmn.map(lambda x: int(str(x).zfill(4)[2:4]))
df.drop('hrmn', axis=1, inplace=True)
df['dt'] = pd.to_datetime(df[['year', 'month', 'day', 'hour', 'minute']])
df.set_index('dt', inplace=True)
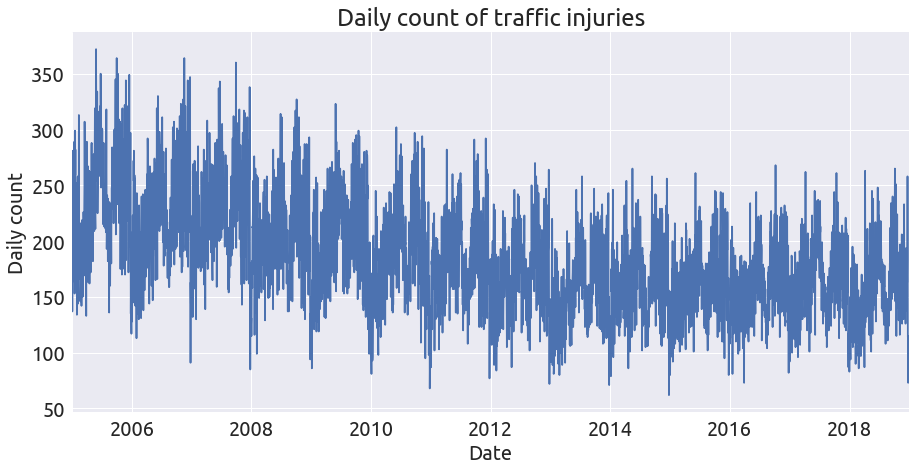
And we can plot the daily count of traffic injuries:
ax = df.index.to_frame().resample('D').count().plot(legend=False, figsize=(15, 7))
ax.set_xlabel('Date');
ax.set_ylabel('Daily count');
ax.set_title('Daily count of traffic injuries');
Map of traffic injuries
Now we focus on the coordinate columns lat and long. Also we select only the mainland france area (gps = M):
coords = df[df.gps == 'M'][['lat', 'long']].dropna(how='any')
coords.info()
<class 'pandas.core.frame.DataFrame'>
DatetimeIndex: 456090 entries, 2018-01-24 15:05:00 to 2005-12-11 12:55:00
Data columns (total 2 columns):
 #   Column  Non-Null Count   Dtype
---  ------  --------------   -----
 0   lat     456090 non-null  float64
 1   long    456090 non-null  object
dtypes: float64(1), object(1)
memory usage: 10.4+ MB
It appears that the long column contain some numbers (a lot of zeros actually!) and some str values:
coords.long.value_counts()
0.0         97426
0           28975
-            3209
345699.0      162
228547.0      131
            ...
247394.0        1
441588.0        1
247392.0        1
441590.0        1
241601.0        1
Name: long, Length: 205130, dtype: int64
So we remove the str values and convert the long column to float:
coords = coords.loc[coords.long != '-'].copy(deep=True)
coords['long'] =  coords['long'].astype(float)
coords.head(2)
| lat | long | |
|---|---|---|
| dt | ||
| 2018-01-24 15:05:00 | 5055737.0 | 294992.0 |
| 2018-02-12 10:15:00 | 5052936.0 | 293151.0 |
The coordinates are expressed in “decimal degrees”… We convert them to WGS84 by dividing by 100000:
coords /= 100000
Also, we filter the points with a bounding box of mainland france:
bbox = (-5., 39., 10., 54.)
coords = coords[(coords.long > bbox[0]) & (coords.lat > bbox[1]) & (coords.long < bbox[2]) & (coords.lat < bbox[3])]
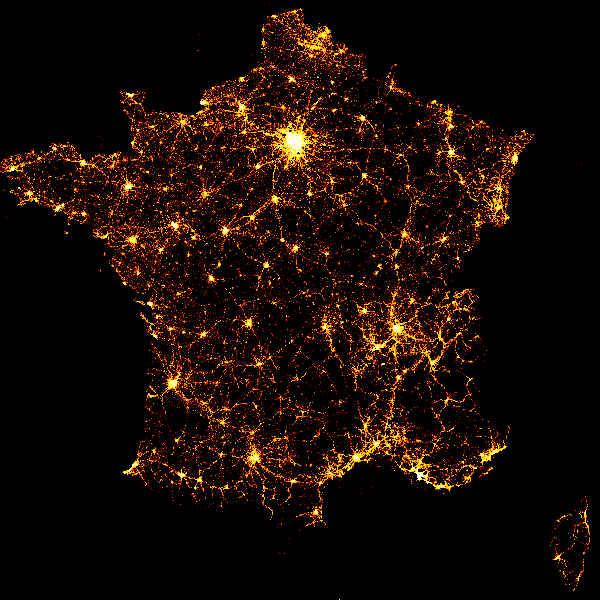
And that’s it! We can eventually call datashader:
cmap = palette['CET_L19']
bg_col = 'white'
size = 1200
cvs = ds.Canvas(plot_width=size, plot_height=size)
agg = cvs.points(coords, 'long', 'lat')
img = tf.shade(agg, cmap=cmap)
img = tf.set_background(img, bg_col)
img
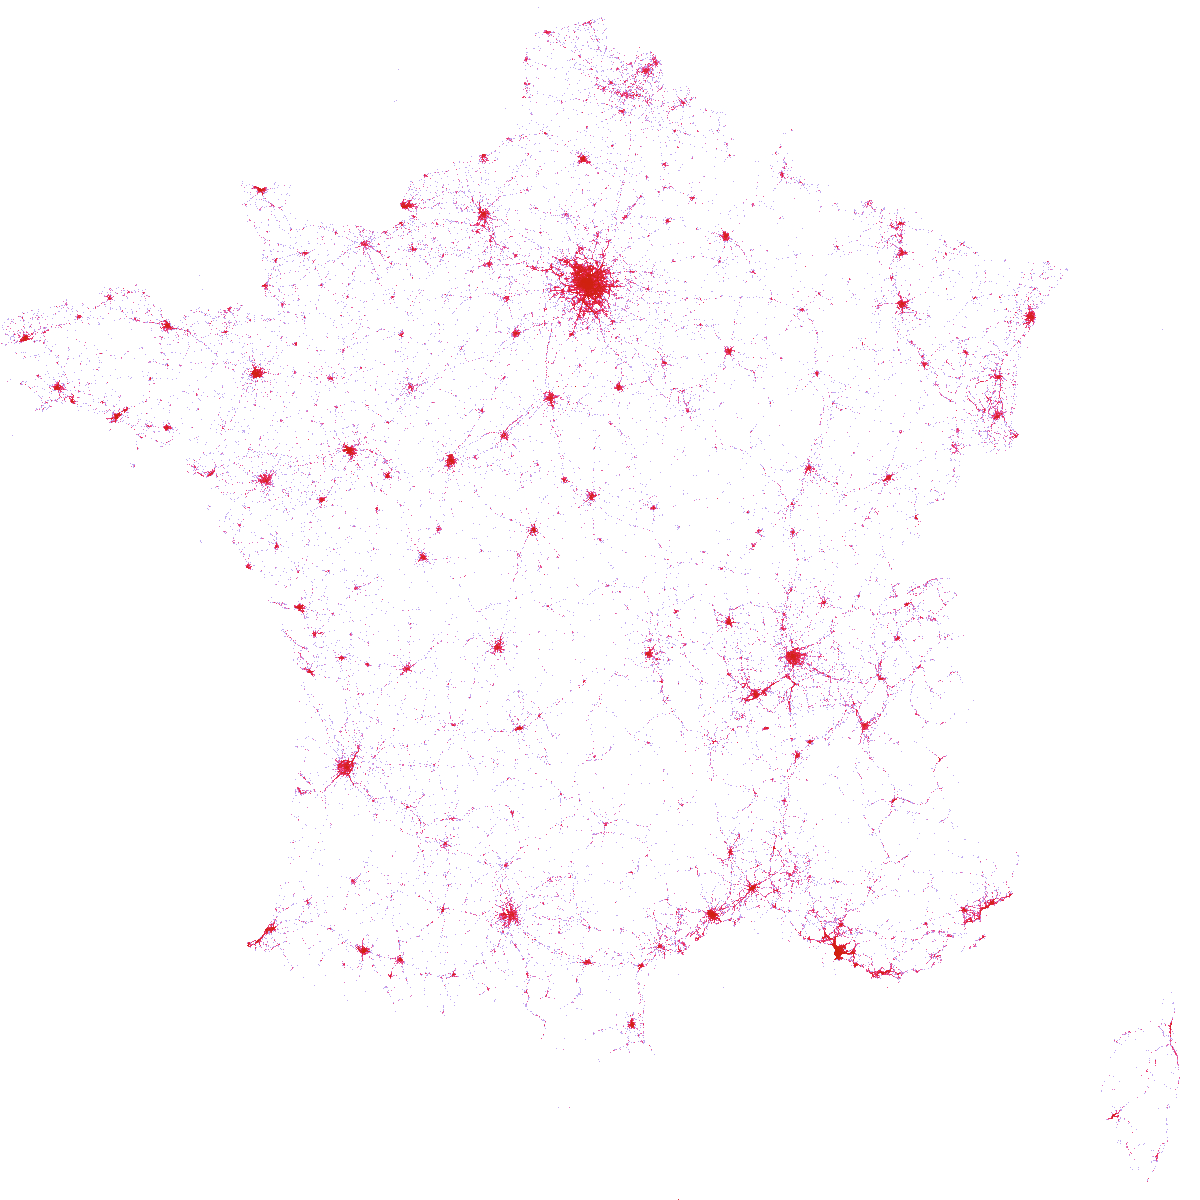
This confirms my intuition that driving in Paris is dangerous :)