Lunch break, fetching AROME temperature forecast in Lyon
Since a “small” heat wave is coming, I would like to get some temperature forecast for the next hours in my neighborhood, from my JupyterLab notebook.
We are going to fetch the results from the Météo-France AROME 0.01 model. Here is the AROME item listed in the Météo-France web service documentation:
Results from the French high resolution atmospheric forecast model (called AROME) on a grid with a resolution of 0°01 or 0°025 for France. Data is updated every 3 hours and available up to 42 hours, with a temporal resolution of 1 hour.
The weather forecast data are under an ETALAB open license. Note that an access request must be made to support.inspire@meteo.fr in order to get some credentials for these web services.
We are going to use the PyMeteoFr package, which is a Python wrapper of the Météo-France web services, despite that this package is young and hasn’t reached a stable level yet.

Imports
import pytz

from pymeteofr import Fetcher

TOKEN = "__YOUR_TOKEN_HERE__"  # API key
Fetching the temperature forecast
Let’s instanciate a PyMeteoFr Fetcher instance with the API key:
fetcher = Fetcher(token=TOKEN)
Now that the token is set, we need to choose which weather-related product we are interested in. This is done using the select_product method with appropriate arguments: dataset, area and accuracy:
fetcher.select_product(dataset="arome", area="france", accuracy=0.01)
-- GetCapabilities request --
Then we choose a meteorological variable from AROME: Temperature at specified height level above ground, and a forecasting horizon: 35 hours
fetcher.list_titles()
['Brightness temperature',
 'Convective available potential energy',
 'Geometric height',
 'High cloud cover',
 'Low cloud cover',
 'Medium cloud cover',
 'Pressure',
 'Relative humidity at specified height level above ground',
 'Temperature at specified height level above ground',
 'Wind speed (gust) at specified height level above ground',
 'Wind speed at specified height level above ground',
 'rainfall rate',
 'u component of wind at specified height level above ground',
 'u component of wind gust at specified height level above ground',
 'v component of wind at specified height level above ground',
 'v component of wind gust at specified height level above ground']
fetcher.select_coverage_id(title="Temperature at specified height level above ground")
fetcher.check_run_time(horizon=35)
-- DescribeCoverage request --
The run_time is a time stamp identifying when the model was run. The latest available run time (UTC) for our temperature forecast is the following:
fetcher.run_time
'2020-07-30T06:00:00Z'
Finally we need to set a point of interest, which is my street with a longitude and a latitude:
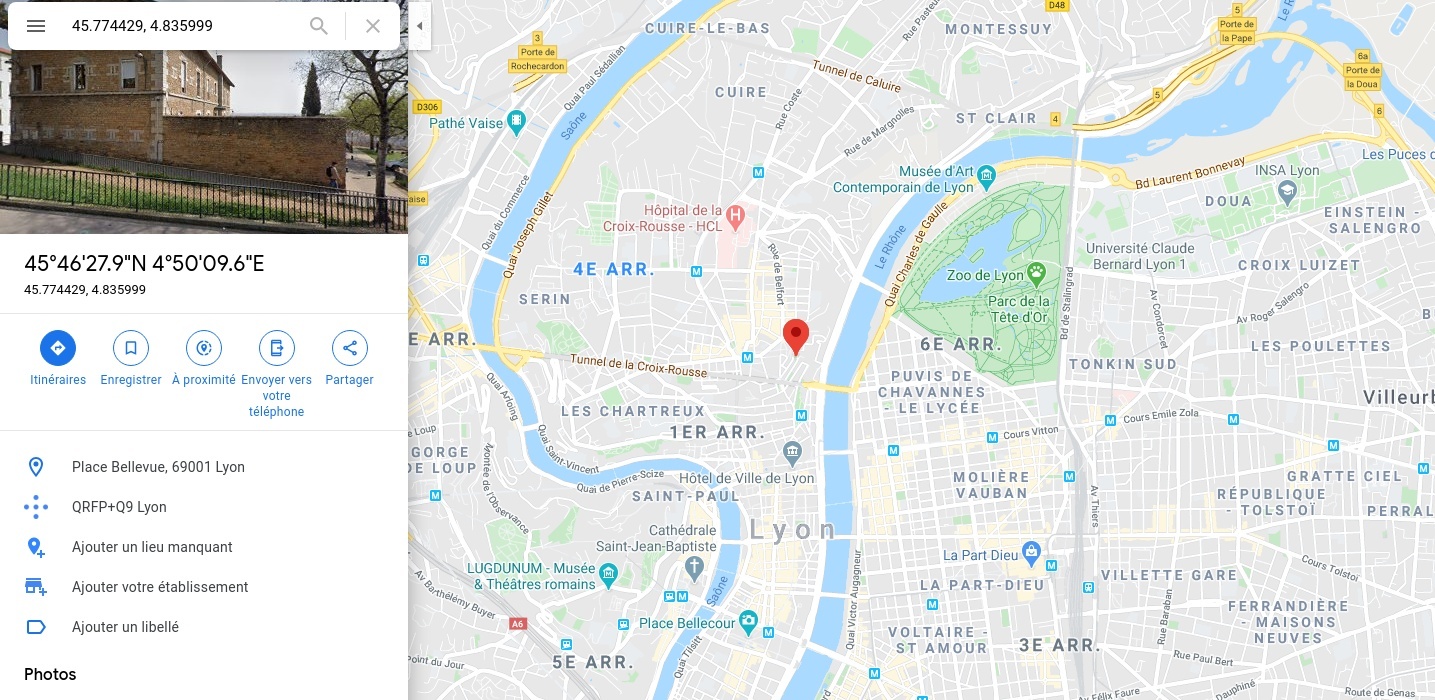
fetcher.set_poi("lyon", 4.835999, 45.774429)
Let’s fetch the temperature forecast and copy the resulting Pandas object:
%%time
fetcher.create_time_series()
forecast = fetcher.series.copy(deep=True)
-- GetCoverage request 2020-07-30T11:00:00Z --
-- GetCoverage request 2020-07-30T12:00:00Z --
-- GetCoverage request 2020-07-30T13:00:00Z --
…
-- GetCoverage request 2020-07-31T19:00:00Z --
-- GetCoverage request 2020-07-31T20:00:00Z --
-- GetCoverage request 2020-07-31T21:00:00Z --
CPU times: user 1.32 s, sys: 56.8 ms, total: 1.38 s
Wall time: 32 s
forecast.head(2)
| lyon | |
|---|---|
| 2020-07-30 11:00:00 | 32.077190 |
| 2020-07-30 12:00:00 | 34.052318 |
Plot
Before plotting, we need to change the DatetimeIndex from UTC to the local timezone:
forecast.index.name = "Date"
forecast.reset_index(drop=False, inplace=True)
forecast.Date = forecast.Date.dt.tz_localize(pytz.timezone("UTC"))
forecast.Date = forecast.Date.dt.tz_convert(tz=pytz.timezone("Europe/Paris"))
forecast.Date = forecast.Date.dt.tz_localize(None)
forecast.set_index("Date", inplace=True)
forecast.head(2)
| lyon | |
|---|---|
| Date | |
| 2020-07-30 13:00:00 | 32.077190 |
| 2020-07-30 14:00:00 | 34.052318 |
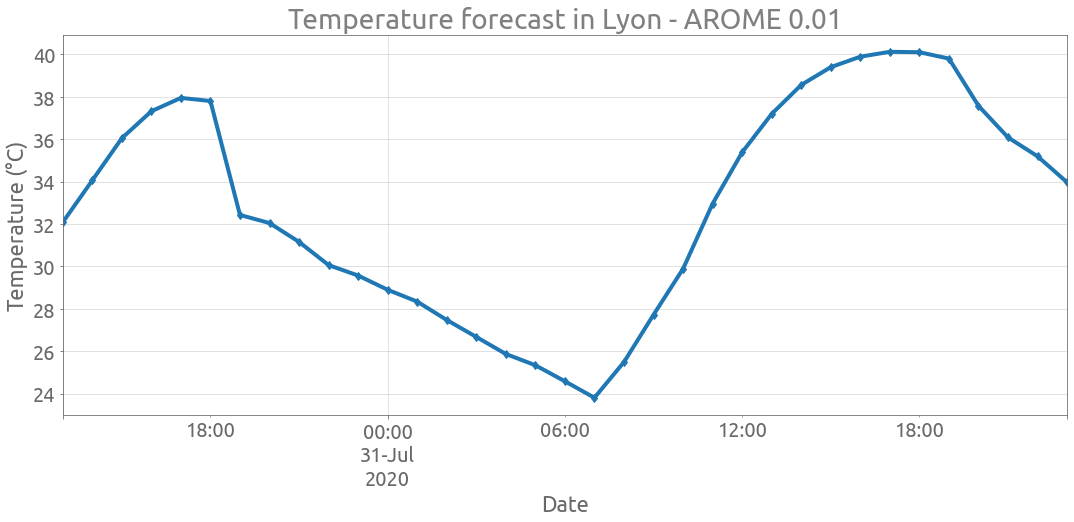
ax = forecast.plot(style="d-", figsize=(18, 7), legend=False)
ax.grid()
ax.autoscale(enable=True, axis="x", tight=True)
_ = ax.set(title="Temperature forecast in Lyon - AROME 0.01", ylabel="Temperature (°C)")