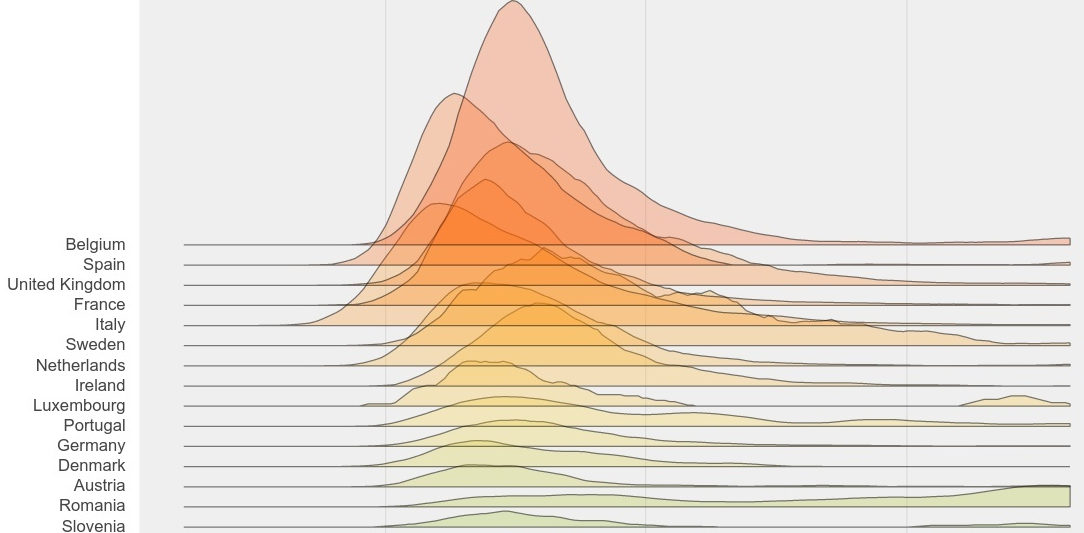
Lunch break, ridge plots with Bokeh
Bokeh is a great visualization Python library. In this short post, we are going to use it to create a ridge plot.

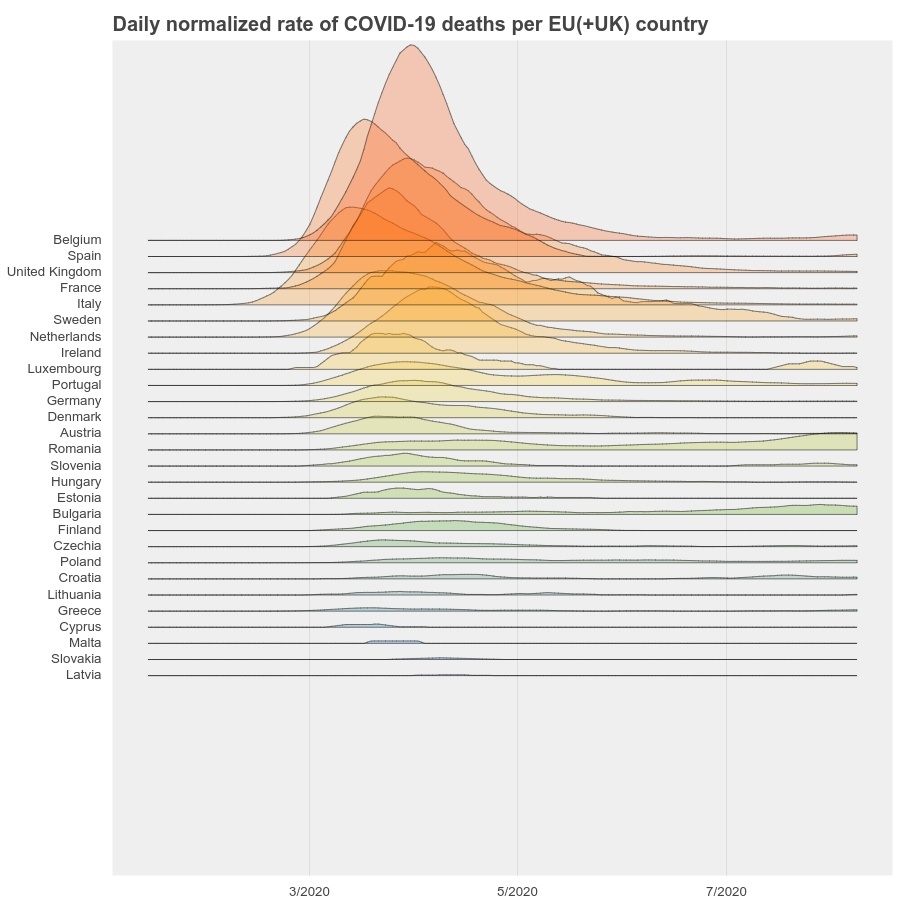
For that purpose, we use the COVID-19 death data from Johns Hopkins University, and plot the daily normalized death rate (100000 * number of daily deaths / population) per EU(+UK) country.
Imports
import colorcet as cc
import numpy as np
import pandas as pd
from bokeh.io import show, output_notebook
from bokeh.models import ColumnDataSource, DatetimeTickFormatter
from bokeh.plotting import figure

output_notebook()

# Johns Hopkins University data url
URL = "https://raw.githubusercontent.com/CSSEGISandData/COVID-19/master/csse_covid_19_data/csse_covid_19_time_series/time_series_covid19_deaths_global.csv"
Load and prepare the data
Load the COVID-19 data into a dataframe:
deaths = pd.read_csv(URL)
deaths.head(2)
| Province/State | Country/Region | Lat | ... | 8/24/20 | 8/25/20 | |
|---|---|---|---|---|---|---|
| 0 | NaN | Afghanistan | 33.93911 | ... | 1389 | 1397 |
| 1 | NaN | Albania | 41.15330 | ... | 254 | 259 |
2 rows × 221 columns
Also load a list of EU countries:
countries = (
    pd.read_csv(
        "https://pkgstore.datahub.io/opendatafortaxjustice/listofeucountries/listofeucountries_csv/data/5ab24e62d2ad8f06b59a0e7ffd7cb556/listofeucountries_csv.csv"
    )
    .values[:, 0]
    .tolist()
)

# Match country names
countries = [c if c != "Czech Republic" else "Czechia" for c in countries]
countries = [c if c != "Slovak Republic" else "Slovakia" for c in countries]

n_countries = len(countries)
print(countries)
['Austria', 'Belgium', 'Bulgaria', 'Croatia', 'Cyprus', 'Czechia', 'Denmark', 'Estonia', 'Finland', 'France', 'Germany', 'Greece', 'Hungary', 'Ireland', 'Italy', 'Latvia', 'Lithuania', 'Luxembourg', 'Malta', 'Netherlands', 'Poland', 'Portugal', 'Romania', 'Slovakia', 'Slovenia', 'Spain', 'Sweden', 'United Kingdom']
We select EU countries in the COVID-19 data:
deaths_eu = deaths.loc[deaths["Country/Region"].isin(countries)].copy(deep=True)

# cleanup
deaths_eu.drop(["Province/State", "Lat", "Long"], axis=1, inplace=True)
deaths_eu = deaths_eu.groupby("Country/Region").sum()  # with overseas territories
deaths_eu.index.name = "Country"
assert len(deaths_eu) == n_countries
deaths_eu.head(2)
| 1/22/20 | 1/23/20 | ... | 8/24/20 | 8/25/20 | |
|---|---|---|---|---|---|
| Country | |||||
| Austria | 0 | 0 | ... | 733 | 733 |
| Belgium | 0 | 0 | ... | 9996 | 9996 |
2 rows × 217 columns
Now we load the population count by country into a dataframe. The CSV file comes from this website.
pop = pd.read_csv(
    "./data/population-figures-by-country-csv_csv.csv",
    usecols=["Country", "Country_Code", "Year_2016"],
)
pop.loc[pop.Country == "Czech Republic", "Country"] = "Czechia"
pop.loc[pop.Country == "Slovak Republic", "Country"] = "Slovakia"
And select EU countries:
pop_eu = pop[pop.Country.isin(countries)].copy(deep=True)
pop_eu.drop("Country_Code", axis=1, inplace=True)
pop_eu.set_index("Country", drop=True, inplace=True)
assert len(pop_eu) == n_countries
pop_eu.head(2)
| Year_2016 | |
|---|---|
| Country | |
| Austria | 8747358.0 |
| Belgium | 11348159.0 |
This population data date back to 2016, but it is recent enough for this blog post…
We compute the death density as the number of deaths per 100000 inhabitants for each country:
dd_eu = deaths_eu.div(pop_eu.Year_2016, axis=0) * 100000
dd_eu.head(2)
| 1/22/20 | 1/23/20 | ... | 8/24/20 | 8/25/20 | |
|---|---|---|---|---|---|
| Country | |||||
| Austria | 0.0 | 0.0 | ... | 8.379673 | 8.379673 |
| Belgium | 0.0 | 0.0 | ... | 88.084772 | 88.084772 |
2 rows × 217 columns
Now we pivot the dataframe, convert the index into a DatetimeIndex:
dd_eu = dd_eu.T
dd_eu.index = pd.to_datetime(dd_eu.index)
dd_eu.tail(2)
| Country | Austria | Belgium | ... | Sweden | United Kingdom |
|---|---|---|---|---|---|
| 2020-08-24 | 8.379673 | 88.084772 | ... | 58.698661 | 63.255251 |
| 2020-08-25 | 8.379673 | 88.084772 | ... | 58.708759 | 63.279627 |
2 rows × 28 columns
and compute a smoothed daily count of deaths per 100000 inhabitants:
nd = 5
rate = (
    dd_eu.diff()
    .rolling(nd, center=True)
    .median()
    .rolling(3 * nd, center=False)
    .mean()
    .dropna()
)

rate.tail(2)
| Country | Austria | Belgium | ... | Sweden | United Kingdom |
|---|---|---|---|---|---|
| 2020-08-22 | 0.006859 | 0.066971 | ... | 0.026928 | 0.015032 |
| 2020-08-23 | 0.006859 | 0.066971 | ... | 0.027601 | 0.014423 |
2 rows × 28 columns
Let’s reorder the countries from lowest to highest maximum daily death rate:
order = rate.max(axis=0).sort_values().index.values.tolist()
rate = rate[order]
rate.tail(2)
| Country | Latvia | Slovakia | ... | Spain | Belgium |
|---|---|---|---|---|---|
| 2020-08-22 | 0.0 | 3.700743e-18 | ... | 0.025694 | 0.066971 |
| 2020-08-23 | 0.0 | 3.700743e-18 | ... | 0.029139 | 0.066971 |
2 rows × 28 columns
Here we duplicate the last row in order to later create nice looking Bokeh Patches (with a vertical line on the right side):
rate = pd.concat([rate, rate.tail(1)], axis=0)
rate.iloc[-1] = 0.0
We choose a color palette (linear sampling):
palette = [cc.rainbow[int(i * 9)] for i in range(len(order))]
Finally we can create the ridge plot.
Plot
Most of the following code comes from Bokeh’s documentation.
def ridge(category, data, scale=5):
    return list(zip([category] * len(data), scale * data))


source = ColumnDataSource(data=dict(x=rate.index.values))
p = figure(
    y_range=order,
    plot_height=900,
    plot_width=900,
    toolbar_location=None,
    title="Daily normalized rate of COVID-19 deaths per EU(+UK) country",
)
p.title.text_font_size = "15pt"
p.xaxis.major_label_text_font_size = "10pt"
p.yaxis.major_label_text_font_size = "10pt"

for i, country in enumerate(order):
    y = ridge(country, rate[country])
    source.add(y, country)
    p.patch(
        "x",
        country,
        color=palette[i],
        alpha=0.25,
        line_color="black",
        line_alpha=0.5,
        source=source,
    )

p.outline_line_color = None
p.background_fill_color = "#efefef"

p.xaxis.formatter = DatetimeTickFormatter(days="%m/%d")

p.ygrid.grid_line_color = None
p.xgrid.grid_line_color = "#dddddd"
p.xgrid.ticker = p.xaxis.ticker

p.axis.minor_tick_line_color = None
p.axis.major_tick_line_color = None
p.axis.axis_line_color = None

p.y_range.range_padding = 0.85

show(p)

The highest rate in this plot was reached in Belgium:
rate["Belgium"].max()
2.4268253555488593
str(rate["Belgium"].idxmax().date())
'2020-04-21'