TPC-H benchmark of DuckDB and Hyper on native files
In this blog post, we examine the performance of two popular SQL engines for querying large files:
- Tableau Hyper / Proprietary License
- DuckDB / MIT License These engines have gained popularity due to their efficiency, ease of use, and Python APIs.
To evaluate their performance, we use the TPC-H benchmark, which is a widely-used measure of such systems’ performance, consisting of a set of queries that have broad industry-wide relevance. The data can be created using pre-determined database sizes, referred to as scale factors. In the following with are going to use a rather wide range of scale factors : 1, 3, 10, 30, 100.
All the measurements are performed on the same laptop with a Linux OS. While it is possible to query Parquet files with both engines, we use the native file formats in the following:
- .duckdb for DuckDB
- .hyper for Tableau Hyper
It is usually more efficient to run the queries on the native file format, matching the engine internals, than on Parquet files.
Note that we employ default settings for both packages, and although the presented timings could be improved with configuration options tuning, we present the results without any modifications. It is also important to note that the DuckDB storage format is still under development and not yet stabilized, making it not always backward compatible.
Finally, we are going to see how to generate query execution plans with each engine in Python.
Package versions:
Python          : 3.11.3 | packaged by conda-forge | (main, Apr  6 2023, 08:57:19) [GCC 11.3.0]
DuckDB          : 0.7.2-dev2144
TableauHyperAPI : 0.0.16868
System information
The code is executed on a linux laptop with the following features:
OS : Linux mint 21.1, based on Ubuntu 22.04
CPU : 12th Gen Intel© Core™ i9-12900H (10 cores)
RAM : 32 GB
Data disk : Samsung SSD 980 PRO 1TB
Native file size
The TPC-H data used in this benchmark are generated using the DuckDB TPC-H extension and saved into duckdb and Parquet files with DuckDB.
with duckdb.connect(database=duckdb_file_path, read_only=False) as conn:
    conn.sql("INSTALL tpch")
    conn.sql("LOAD tpch")
    conn.sql("CALL dbgen(sf=10)")
    df = conn.sql("SELECT * FROM information_schema.tables").df()
    table_names = df.table_name.to_list()
    for tbl in table_names:
        parquet_file_path = parquet_dir.joinpath(tbl + ".parquet")
        query = f"COPY (SELECT * FROM {tbl}) TO '{parquet_file_path}' (FORMAT PARQUET)"
        conn.sql(query)
Each Parquet file is then converted into an hyper file with the Tableau Hyper engine.
hyper_schema = 'Export'
with HyperProcess(telemetry=Telemetry.DO_NOT_SEND_USAGE_DATA_TO_TABLEAU) as hyper:
    with Connection(
        endpoint=hyper.endpoint,
        database=hyper_file_path,
        create_mode=CreateMode.CREATE_AND_REPLACE,
    ) as conn:
        conn.catalog.create_schema_if_not_exists(hyper_schema)
        for parquet_file_path in parquet_file_paths:
            file_name = os.path.basename(parquet_file_path)
            table_name = os.path.splitext(file_name)[0]
            table = TableName(hyper_schema, table_name)
            query = f"""CREATE TABLE {table} AS
            (SELECT * FROM external({parquet_file_path}))"""
            conn.execute_command(query)
Here is an array presenting the different file sizes:
| Scale factor | .duckdb file size | .hyper file size | Total .parquet files size | Total row count |
|---|---|---|---|---|
| 1 | 436.0 MB | 436.5 MB | 379 MB | 8 661 245 |
| 3 | 800.6 MB | 1.3 GB | 1.2 GB | 25 976 639 |
| 10 | 2.7 GB | 4.5 GB | 3.8 GB | 86 586 082 |
| 30 | 8.2 GB | 13.6 GB | 12 GB | 259 798 402 |
| 100 | 27.7 GB | 46.3 GB | 38 GB | 866 037 932 |
The total row count corresponds to the sum of 8 table lengths (lineitem, customer, orders, supplier, region, partsupp, nation, part).
Results
Query execution time
We report the combined elapsed time for the 22 TPC-H queries. To ensure accuracy and reduce the impact of fluctuations, we executed each query three times and recorded the best elapsed time out of the three runs. These 22 best elapsed times are then summed.
We did not include fetch time in the elapsed time. We only measure the query execution time. The data is fetched in a second step in order to check the number of rows returned.
- DuckDB:
# start timer
conn.execute(query)
# stop timer

result = conn.df()
n_returned_rows = result.shape[0]
- Hyper
# start timer
result = conn.execute_query(query)
# stop timer

n_returned_rows = 0
while result.next_row():
    n_returned_rows += 1
result.close()
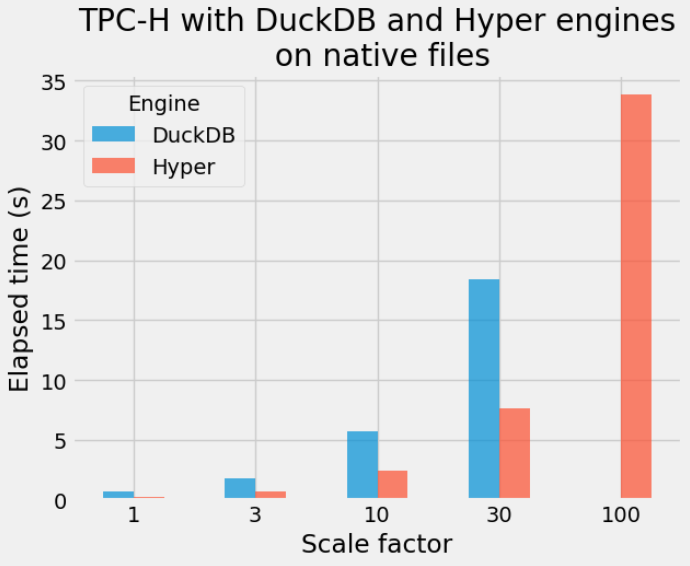
Here are the updated SQL execution timings for both engines across different scale factors:
| Scale factor | DuckDB (s) | Hyper (s) |
|---|---|---|
| 1 | 0.68 | 0.27 |
| 3 | 1.83 | 0.69 |
| 10 | 5.75 | 2.41 |
| 30 | 18.41 | 7.65 |
| 100 | NaN | 33.82 |
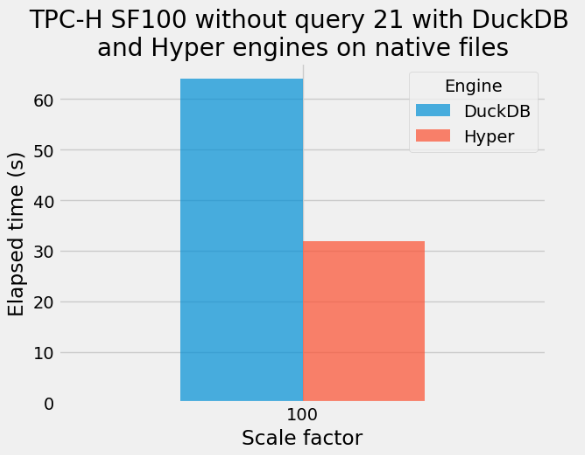
During our analysis on scale factor 100 data, we encountered an error of “cannot allocate memory” when running query 21 using DuckDB. As a result, the corresponding table displays a value of NaN.
Now we also ran the TPC-H queries without query 21 on the data generated with scale factor 100:
Fetching data can introduce additional overhead to query execution time, which is dependent on both the amount of data being transferred and the target container used (such as Pandas or Polars). For instance, in the current experiment with DuckDB and Pandas, fetching the data added approximately 7-8% to the overall execution time.
Query plan for TPC-H query 21 scale factor 100
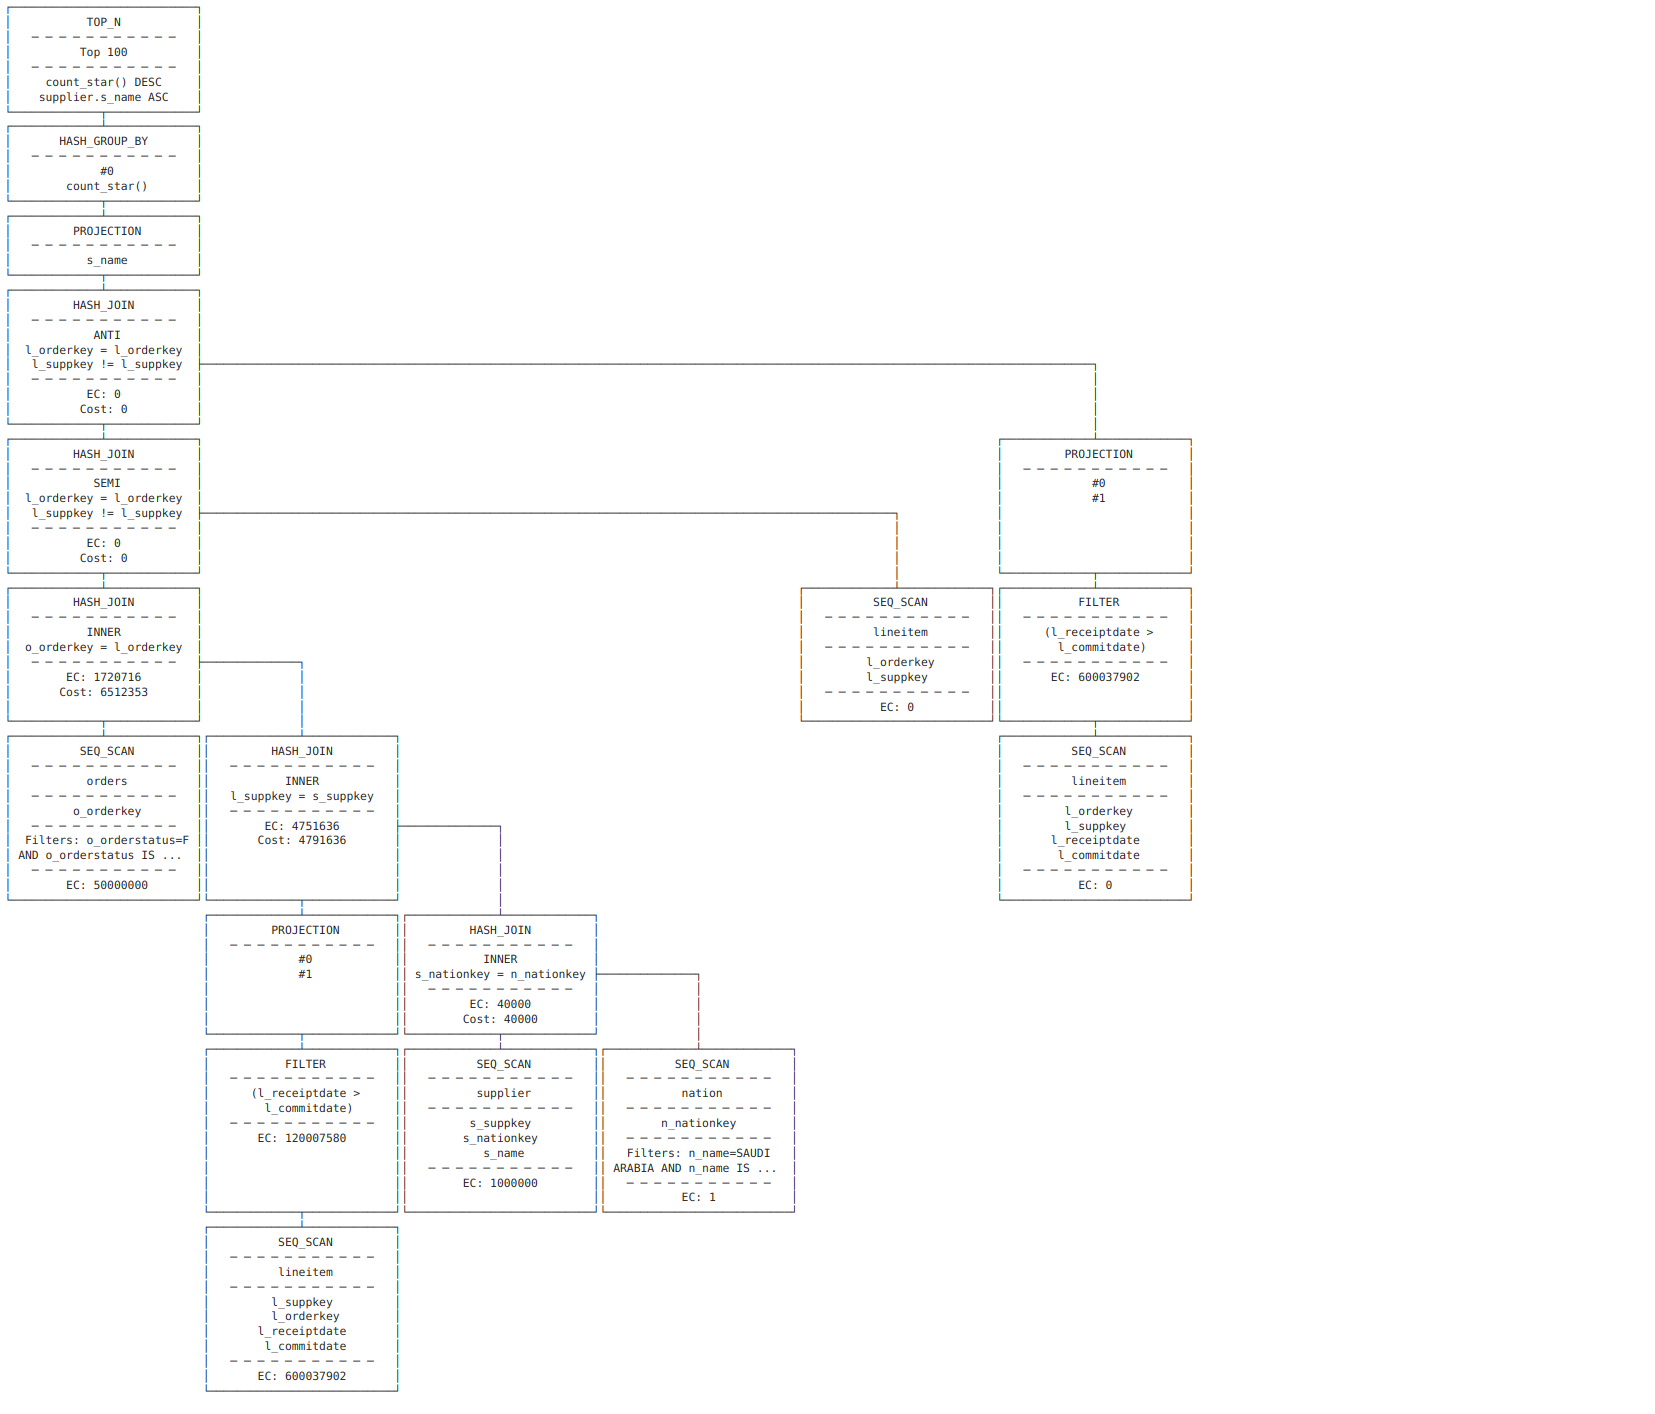
Query execution plans provide a detailed view of how a database engine processes a given query. They describe the various steps involved in the query execution, such as data access, filtering, aggregation, and sorting. Understanding query plans can be critical for optimizing the performance of complex queries, as it allows identifying potential bottlenecks and areas for improvement. In this section, we examine the query execution plans for TPC-H query 21 on a scale factor of 100, as generated by the DuckDB and Tableau Hyper engines.
Imports
import duckdb
from tableauhyperapi import Connection, CreateMode, HyperProcess, Telemetry

duckdb_file_path = "/home/francois/Data/dbbenchdata/tpch_100/data.duckdb"
hyper_file_path = "/home/francois/Data/dbbenchdata/tpch_100/data.hyper"
DuckDB
# query21
query = """EXPLAIN
SELECT
    s_name,
    COUNT(*) AS numwait
FROM
    supplier,
    lineitem l1,
    orders,
    nation
WHERE
    s_suppkey = l1.l_suppkey
    AND o_orderkey = l1.l_orderkey
    AND o_orderstatus = 'F'
    AND l1.l_receiptdate > l1.l_commitdate
    AND EXISTS (
        SELECT
            *
        FROM
            lineitem l2
        WHERE
            l2.l_orderkey = l1.l_orderkey
            AND l2.l_suppkey <> l1.l_suppkey
    )
    AND NOT EXISTS (
        SELECT
            *
        FROM
            lineitem l3
        WHERE
            l3.l_orderkey = l1.l_orderkey
            AND l3.l_suppkey <> l1.l_suppkey
            AND l3.l_receiptdate > l3.l_commitdate
    )
    AND s_nationkey = n_nationkey
    AND n_name = 'SAUDI ARABIA'
GROUP BY
    s_name
ORDER BY
    numwait DESC,
    s_name
LIMIT
    100;"""
conn = duckdb.connect(database=duckdb_file_path, read_only=True)
conn.sql("SET explain_output='all';")
df = conn.sql(query).df()
df.head(3)
| explain_key | explain_value | |
|---|---|---|
| 0 | logical_plan | ┌───────────────────────────┐ ... |
| 1 | logical_opt | ┌───────────────────────────┐ ... |
| 2 | physical_plan | ┌───────────────────────────┐ ... |
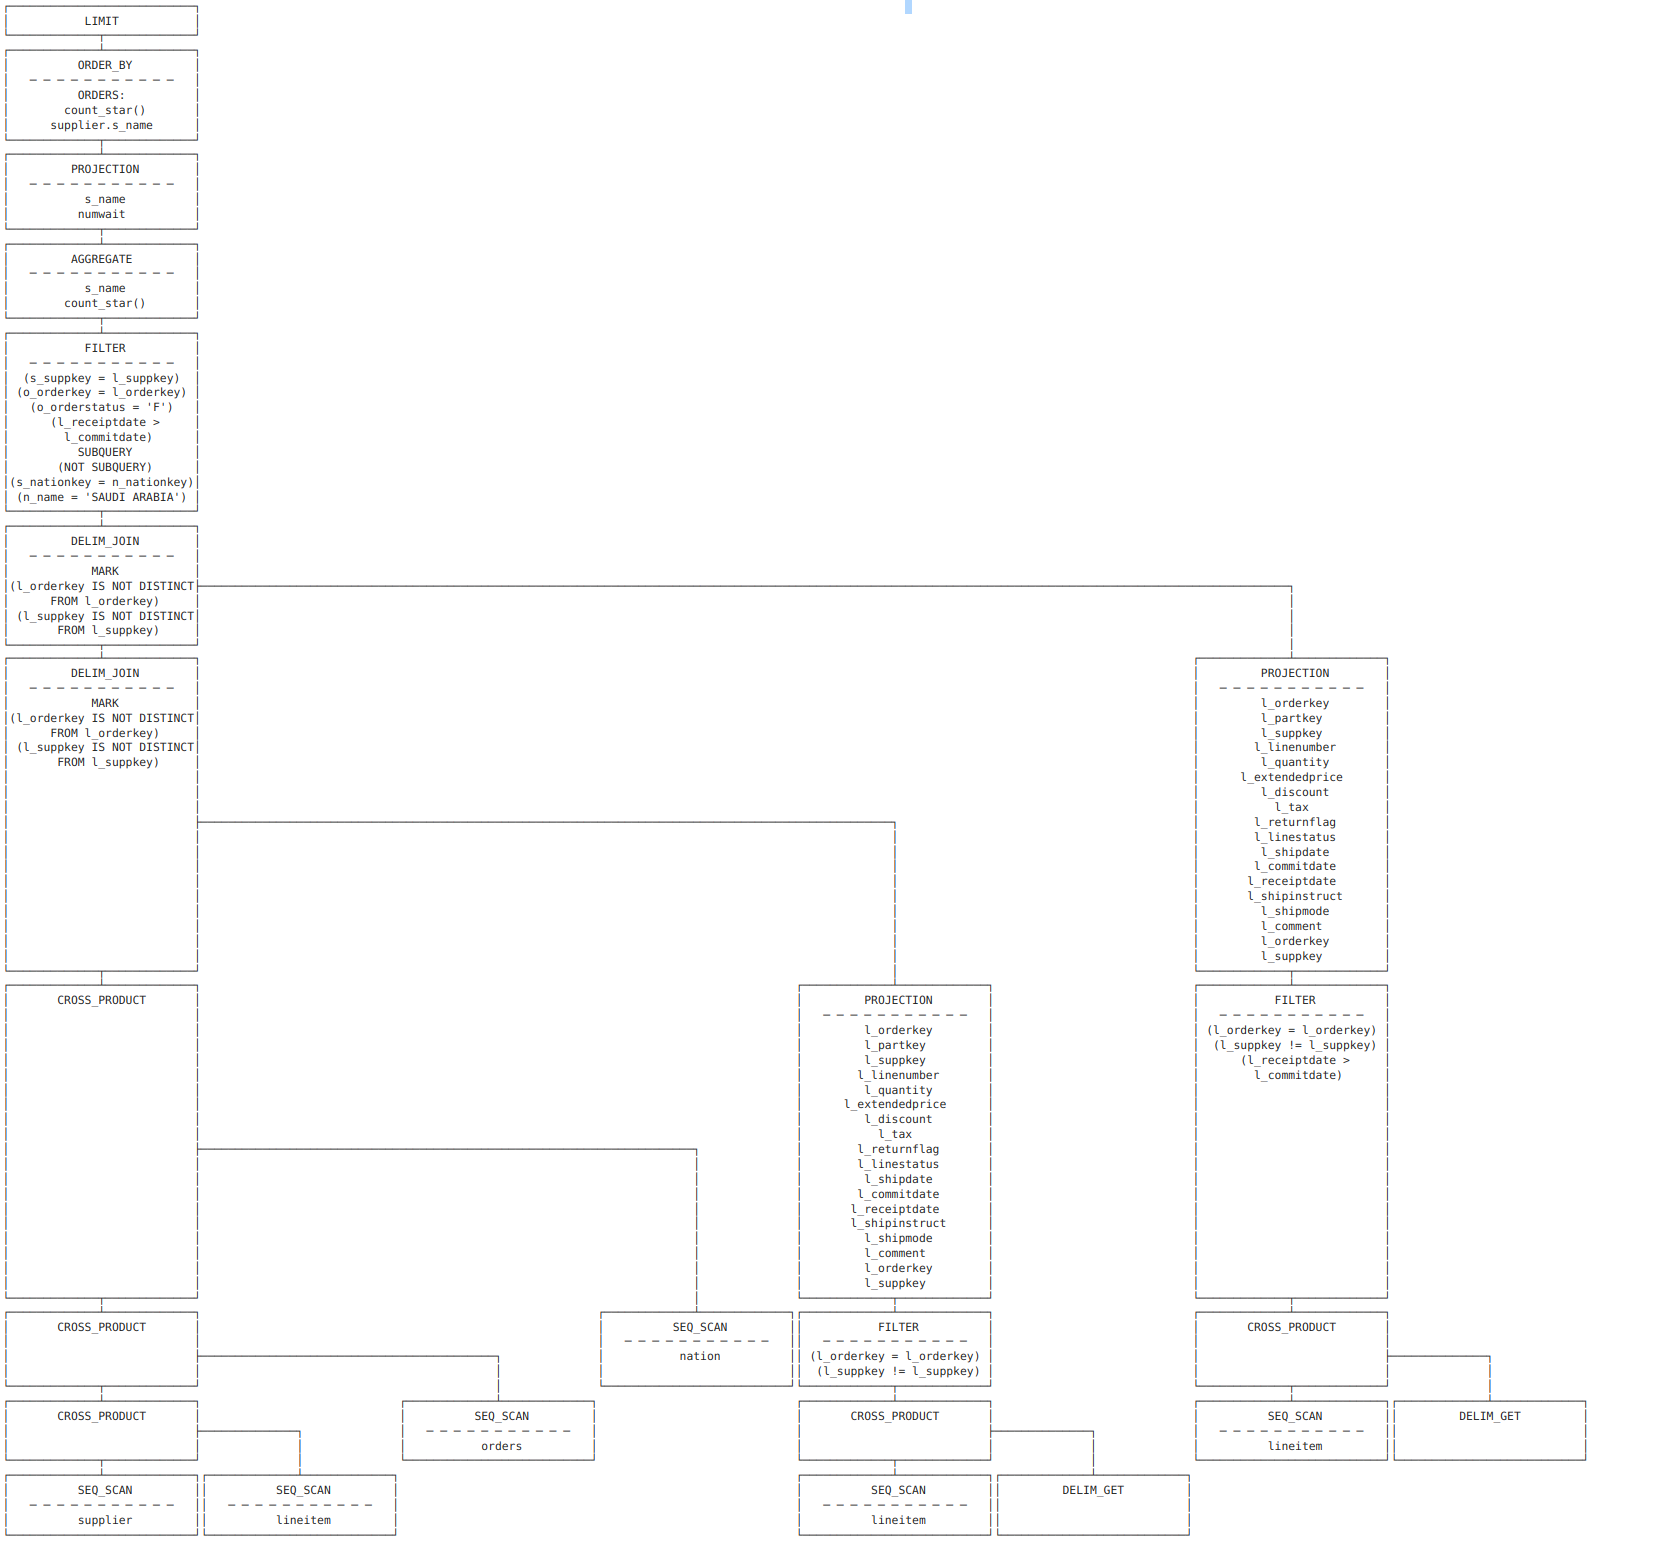
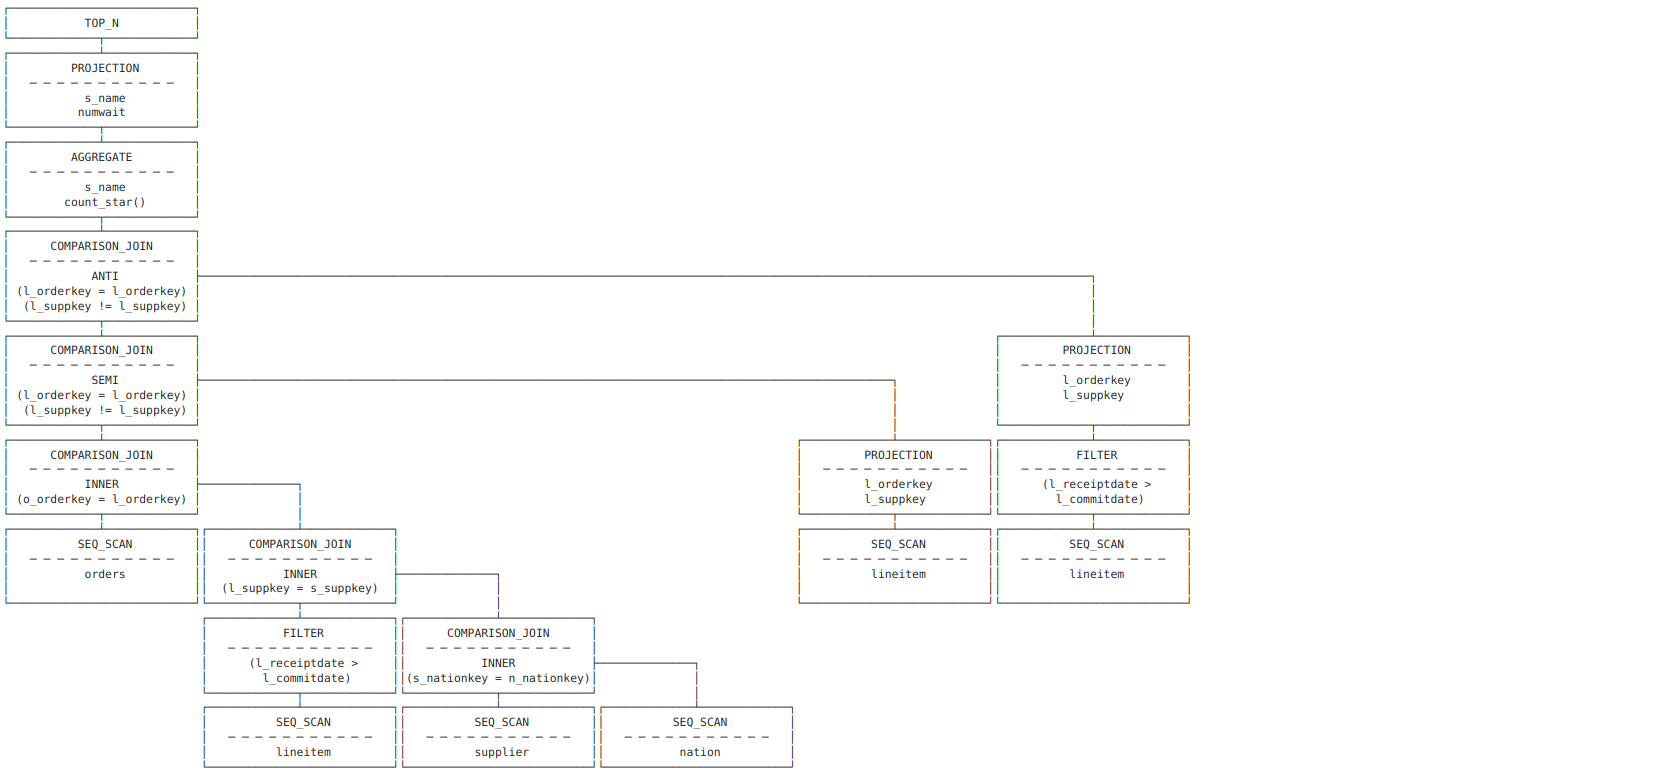
When using the option SET explain_output='all', DuckDB generates 3 different query plans:
logical_planlogical_optphysical_plan
Let’s visualize these plans:
print(df[df.explain_key == "logical_plan"].explain_value.values[0])
print(df[df.explain_key == "logical_opt"].explain_value.values[0])
print(df[df.explain_key == "physical_plan"].explain_value.values[0])
conn.close()
Hyper
The following code is inspired from a Tableau Hyper example: here.
hyper = HyperProcess(telemetry=Telemetry.DO_NOT_SEND_USAGE_DATA_TO_TABLEAU)
conn = Connection(
    endpoint=hyper.endpoint, database=hyper_file_path, create_mode=CreateMode.NONE
)
_ = conn.execute_command("SET schema 'Export';")
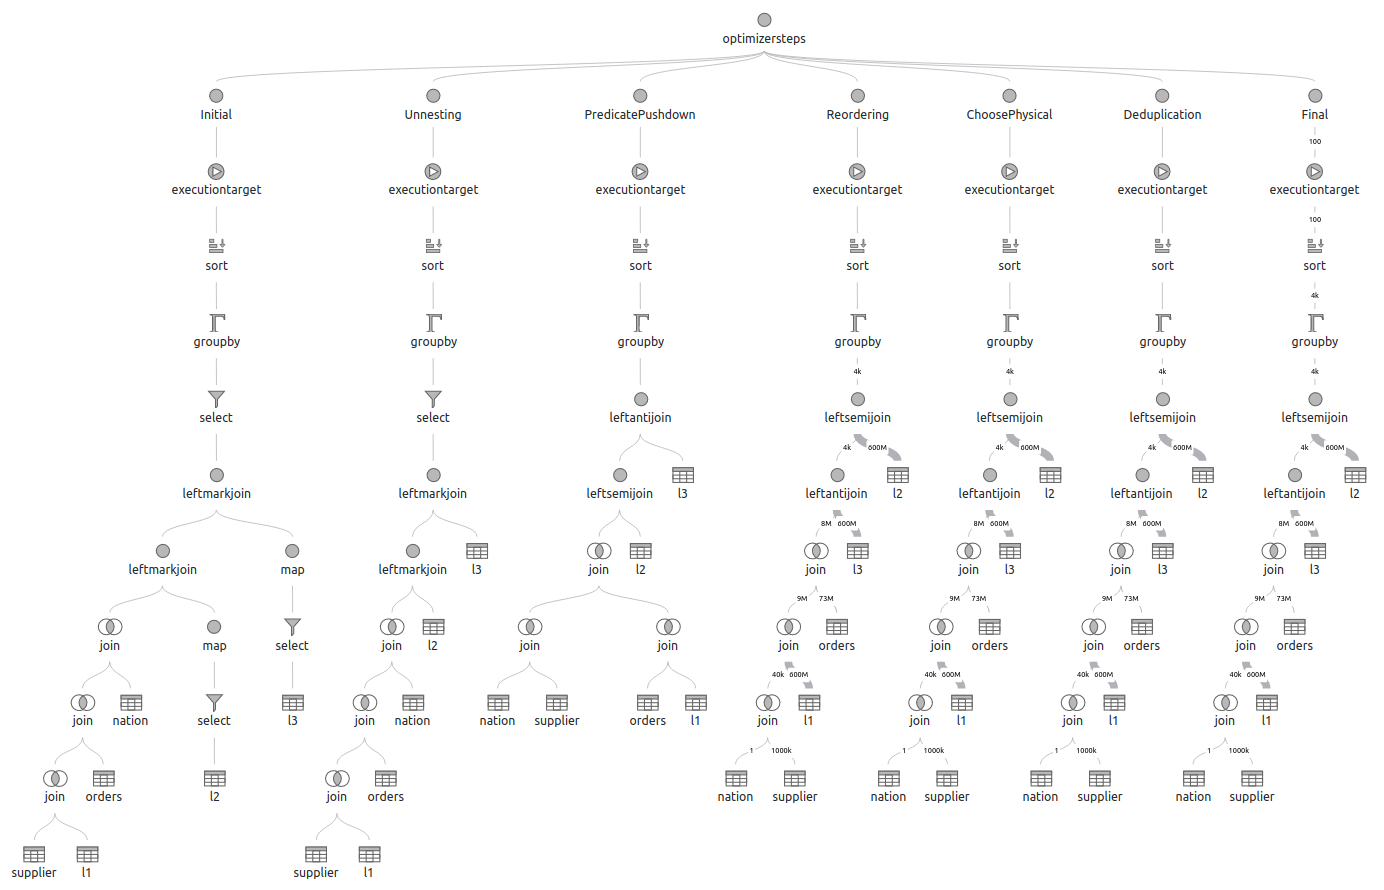
We can generate different plans, either with EXPLAIN, EXPLAIN (VERBOSE, ANALYZE) or with EXPLAIN (VERBOSE, OPTIMIZERSTEPS) . Here is an excerpt from the documenation about the EXPLAIN SQL command here:
There are three types of plans which can be queried:
- The optimized plan. By default, if no other behavior is requested through an
- The optimizer steps. If the
OPTIMIZERSTEPSoption is present, Hyper will output the plan at multiple intermediate steps during query optimization, e.g., before and after join reordering.- The analyzed plan. When invoked with the
ANALYZEoption, Hyper will actually execute the query, including all side effects (inserted/deleted tuples, etc.). Instead of the normal query results, you will however receive the query plan of the query, annotated with runtime statistics such as the number of tuples processed by each operator.
Let’s generate two detailed graphs: the analyzed plan and the optimizer steps. We export them as json files and then use a great interactive query plan visualizer developed by Tableau: https://tableau.github.io/query-graphs/. Also there is rewrite (here) of the rendering layer of query-graphs currently ongoing, by Adrian Vogelsgesang (Tableau). It should be merged into the official Tableau query-graphs repository soon. This is is the one we are going to use next.
explain = "EXPLAIN (VERBOSE, ANALYZE) "
planRes = conn.execute_query(explain + query)
targetPath = "./plan_analyze.json"
plan = "\n".join(r[0] for r in planRes)
with open(targetPath, "w") as f:
    f.write(plan)
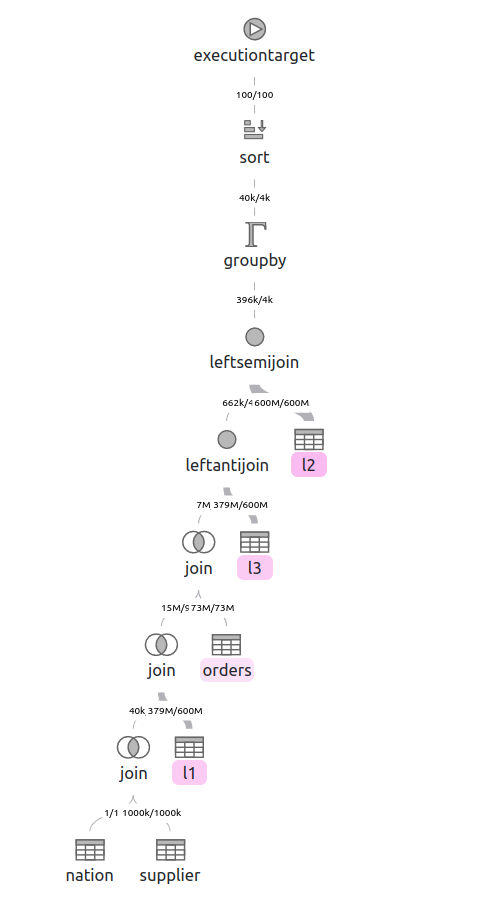
Note that the graph nodes can be expanded and give more information than on this screen capture.
explain = "EXPLAIN (VERBOSE, OPTIMIZERSTEPS) "
planRes = conn.execute_query(explain + query)
targetPath = "./plan_optimizersteps.json"
plan = "\n".join(r[0] for r in planRes)
with open(targetPath, "w") as f:
    f.write(plan)
conn.close()
hyper.close()
These query plans could help us to gain insights into how each engine approaches the query and identify possible differences in performance.