Python plot - Antarctic sea ice extent
Data source : https://ads.nipr.ac.jp/vishop/#/extent
REGION SELECTOR = Antarctic
At the bottom of the page : Download the sea ice extent (CSV file) - seasonal dataset
From the National Institute of Polar Research (Japan) website:
The sea-ice extent is calculated as the areal sum of sea ice covering the ocean where sea-ice concentration (SIC) exceeds a threshold (15% for AMSR-E). SICs are derived from various satellite-borne passive microwave radiometer (PMR) sensors using the algorithm developed and provided by Dr. Comiso of NASA GSFC through a cooperative relationship between NASA and JAXA. The following sensor’s data were used;
• Jan. 1980 ~ Jul. 1987 : SMMR
• Jul. 1987 ~ Jun. 2002 : SSM/I
• Jun. 2002 ~ Oct. 2011 : AMSR-E
• Oct. 2011 ~ Jul. 2012 : WindSat
• Jul. 2012 ~ the present : AMSR2
import matplotlib.pyplot as plt
import numpy as np
import pandas as pd
plt.style.use("fivethirtyeight")

CSV_FILE_PATH = "./VISHOP_EXTENT_GRAPH_Antarctic.csv"
FS = (12, 7)  # figure size
Load the Data
df = pd.read_csv(CSV_FILE_PATH)
df.head(3)
| #num | month | date | ... | 2021 | 2022 | 2023 | |
|---|---|---|---|---|---|---|---|
| 0 | 0 | 1 | 1 | ... | 6568300.0 | 5778923.0 | 4777328.0 |
| 1 | 1 | 1 | 2 | ... | 6451907.0 | 5570948.0 | 4644691.0 |
| 2 | 2 | 1 | 3 | ... | 6325097.0 | 5411740.0 | 4485865.0 |
3 rows × 54 columns
We remove columns that are not specific years (#num, month, date, time[second], 1980's Average, …)
cols = df.columns
cols = [c for c in cols if (len(c) == 4) and c.isnumeric() and (c.startswith("19") or c.startswith("20"))]
df = df[cols]
df = df.astype(float)
df = df.replace(-9999.0, np.nan)
df.head(3)
| 1978 | 1979 | 1980 | ... | 2021 | 2022 | 2023 | |
|---|---|---|---|---|---|---|---|
| 0 | NaN | NaN | 5966499.0 | ... | 6568300.0 | 5778923.0 | 4777328.0 |
| 1 | NaN | 6988174.0 | NaN | ... | 6451907.0 | 5570948.0 | 4644691.0 |
| 2 | NaN | NaN | 5855460.0 | ... | 6325097.0 | 5411740.0 | 4485865.0 |
3 rows × 46 columns
Non-leap years
The dataframe columns correspond to years and rows to (month , day) combinations. Thus, February 29th has missing values on non-leap years. We shift the values on these years in order to have a day-of-year row index without missing values on the 29th of February:
df.iloc[58:61][[str(y) for y in range(2014, 2024)]]
| 2014 | 2015 | 2016 | ... | 2021 | 2022 | 2023 | |
|---|---|---|---|---|---|---|---|
| 58 | 3753923.0 | 3800984.0 | 2857127.0 | ... | 3197871.0 | 2211479.0 | 2063912.0 |
| 59 | NaN | NaN | 2853039.0 | ... | NaN | NaN | NaN |
| 60 | 3772864.0 | 3807337.0 | 2863943.0 | ... | 3336462.0 | 2231068.0 | 2095439.0 |
for year in range(1978, 2024):
    if (year - 1972) % 4 != 0:
        year_str = str(year)
        if year_str in df:
            df.loc[59:365, year_str] = df.loc[59:365, year_str].shift(-1)
df.iloc[58:61][[str(y) for y in range(2014, 2024)]]
| 2014 | 2015 | 2016 | ... | 2021 | 2022 | 2023 | |
|---|---|---|---|---|---|---|---|
| 58 | 3753923.0 | 3800984.0 | 2857127.0 | ... | 3197871.0 | 2211479.0 | 2063912.0 |
| 59 | 3772864.0 | 3807337.0 | 2853039.0 | ... | 3336462.0 | 2231068.0 | 2095439.0 |
| 60 | 3805451.0 | 3803617.0 | 2863943.0 | ... | 3474391.0 | 2263092.0 | 2095754.0 |
Long time range daily mean
year_start = 1978
year_end = 2012
current_year = 2023
df[f"{year_start}-{year_end} mean"] = df[
    [str(y) for y in range(year_start, year_end + 1)]
].mean(axis=1)
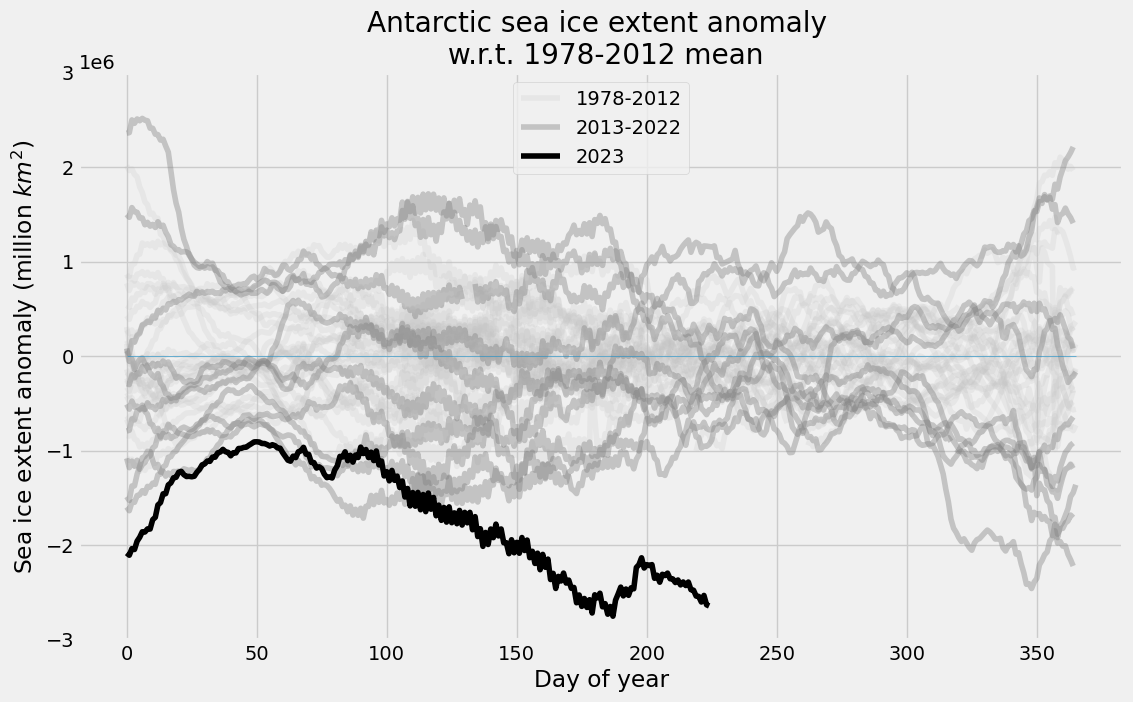
Figure
alpha_1 = 0.2
color_1 = "silver"
alpha_2 = 0.4
color_2 = "grey"
color_3 = "black"

ax = (df[f"{year_start}"] - df[f"{year_start}-{year_end} mean"]).plot(
    figsize=FS, color=color_1, alpha=alpha_1
)
for year in [str(y) for y in range(year_start + 1, year_end)]:
    ax = (df[year] - df[f"{year_start}-{year_end} mean"]).plot(
        ax=ax, color=color_1, alpha=alpha_1
    )
ax = (df[f"{year_end}"] - df[f"{year_start}-{year_end} mean"]).plot(
    ax=ax, color=color_1, label=f"{year_start}-{year_end}", alpha=alpha_1
)

ax = (df[f"{year_end+1}"] - df[f"{year_start}-{year_end} mean"]).plot(
    ax=ax, color=color_2, alpha=alpha_2
)
for year in [str(y) for y in range(year_end + 2, current_year - 1)]:
    ax = (df[year] - df[f"{year_start}-{year_end} mean"]).plot(
        ax=ax, color=color_2, alpha=alpha_2
    )
ax = (df[f"{current_year-1}"] - df[f"{year_start}-{year_end} mean"]).plot(
    ax=ax, color=color_2, label=f"{year_end+1}-{current_year-1}", alpha=alpha_2
)

ax = (df[f"{current_year}"] - df[f"{year_start}-{year_end} mean"]).plot(
    ax=ax, color=color_3, label=f"{current_year}", alpha=1.0
)

plt.hlines(y = 0, xmin = 0, xmax = 365, alpha=0.7, linewidth=0.5)
_ = ax.set_ylim(-3e6, +3e6)
_ = ax.legend()
_ = ax.set(
    title=f"Antarctic sea ice extent anomaly \n w.r.t. {year_start}-{year_end} mean",
    xlabel="Day of year",
    ylabel="Sea ice extent anomaly (million $km^2$)",
)