Performance Analysis of Parallel Data Replication Between Two PostgreSQL 18 Instances on OVH WIP
Introduction
Parallel data replication between PostgreSQL instances presents unique challenges at scale, particularly when attempting to maximize throughput on high-performance cloud infrastructure. FastTransfer is a commercial data migration tool designed to leverage advanced parallelization strategies for efficient data movement. This post provides an in-depth performance analysis of FastTransfer transferring 113GB of data between two PostgreSQL 18 instances on OVH c3-256 servers, examining CPU, disk I/O, and network bottlenecks across parallelism degrees from 1 to 128.
Test Configuration
The test dataset consists of the TPC-H SF100 lineitem table (~600M rows, ~113GB), configured as an UNLOGGED table without indexes, constraints, or triggers. Testing was performed at eight parallelism degrees: 1, 2, 4, 8, 16, 32, 64, and 128.
Both instances were tuned for bulk loading operations, with all durability features disabled, large memory allocations, and PostgreSQL 18’s io_uring support enabled (configuration details in Appendix A). Despite this comprehensive optimization, it appears that severe lock contention emerges at high parallelism degrees, fundamentally limiting scalability.
OVH Infrastructure Setup
The test environment consists of two identical OVH cloud instances designed for high-performance workloads:
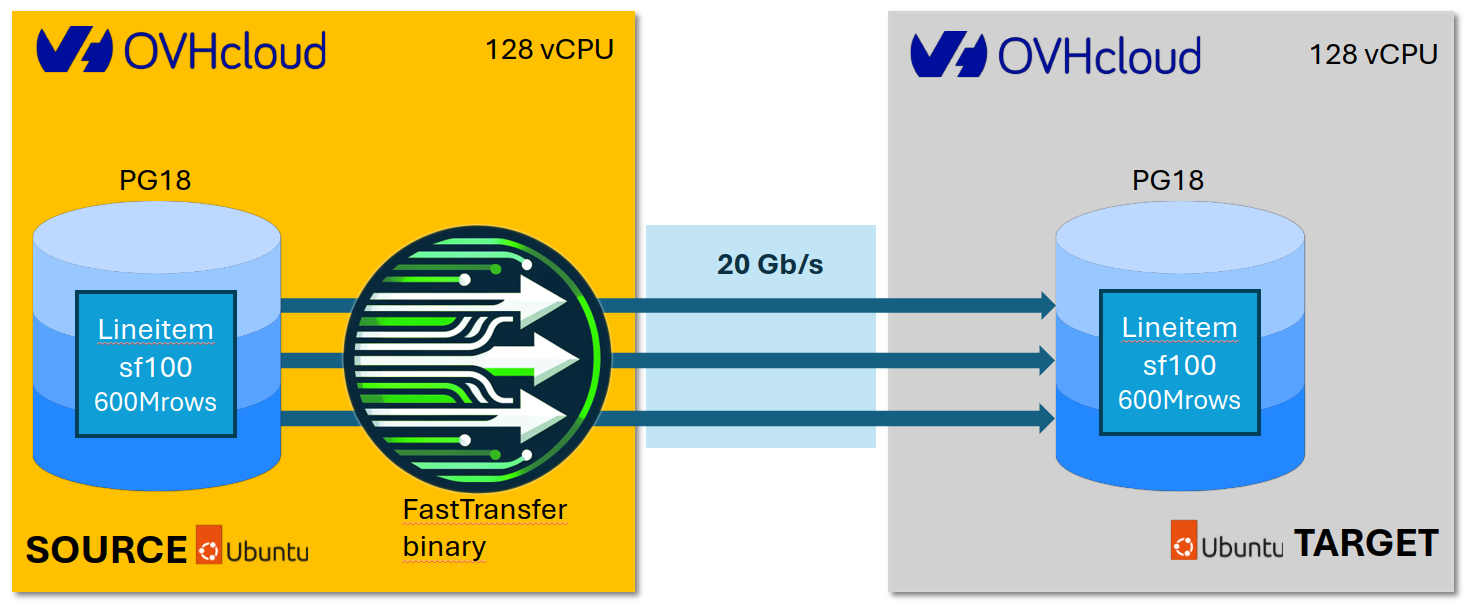
Figure 1: OVH Infrastructure Architecture - The test setup consists of two identical c3-256 instances (128 vCores, 256GB RAM, 400GB NVMe) running PostgreSQL 18 on Ubuntu 24.04. The source instance contains the TPC-H SF100 lineitem table (~600M rows, 113GB). FastTransfer orchestrates parallel data replication across a 20 Gbit/s vrack private network connection to the target instance. Both instances are located in the Paris datacenter (eu-west-par-c) for minimal network latency.
Hardware Configuration:
- Instance Type: OVH c3-256
- Memory: 256GB RAM
- CPU: 128 vCores @ 2.3 GHz
- Storage:
- Target: 400GB local NVMe SSD
- Source: OVH Block Storage (high-speed-gen2, 1.95 TiB, 30 IOPS/GB up to 20,000 IOPS max, 0.5 MB/s/GB up to 1 GB/s max)
- Network: 20 Gbit/s vrack (2.5 GB/s)
Note on Storage Configuration: The source instance PostgreSQL data directory resides on attached OVH Block Storage rather than local NVMe. This asymmetric storage configuration does not affect the analysis conclusions, as the source PostgreSQL instance exhibits backpressure behavior (low CPU utilization at 0.11 cores/process at degree 128) rather than storage-limited performance, confirming that the target instance lock contention remains the primary bottleneck.
Software Stack:
- OS: Ubuntu 24.04.3 LTS with Linux kernel 6.8
- PostgreSQL: Version 18 with io_uring, huge pages (vm.nr_hugepages=45000), autovacuum_worker_slots
Infrastructure Performance Baseline:
- Network: 20.5 Gbit/s (2.56 GB/s) verified with iperf3
- Disk Sequential Write: 3,741 MB/s (FIO benchmark with 128K blocks)
- Disk Random Read: 313 MB/s, 80,200 IOPS (FIO, 4K blocks)
- Disk Random Write: 88.2 MB/s, 22,600 IOPS (FIO, 4K blocks)
Executive Summary
FastTransfer achieves strong absolute performance, transferring 113GB in just 67 seconds at degree 128, equivalent to 1.69 GB/s sustained throughput. The parallel replication process scales continuously across all tested degrees, with total elapsed time decreasing from 878 seconds (degree 1) to 67 seconds (degree 128), representing a 13.1x speedup. While this represents 10.2% efficiency relative to the theoretical 128x maximum, the system delivers consistent real-world performance improvements even at extreme parallelism levels, though lock contention on the target PostgreSQL instance increasingly limits scaling efficiency beyond degree 32.
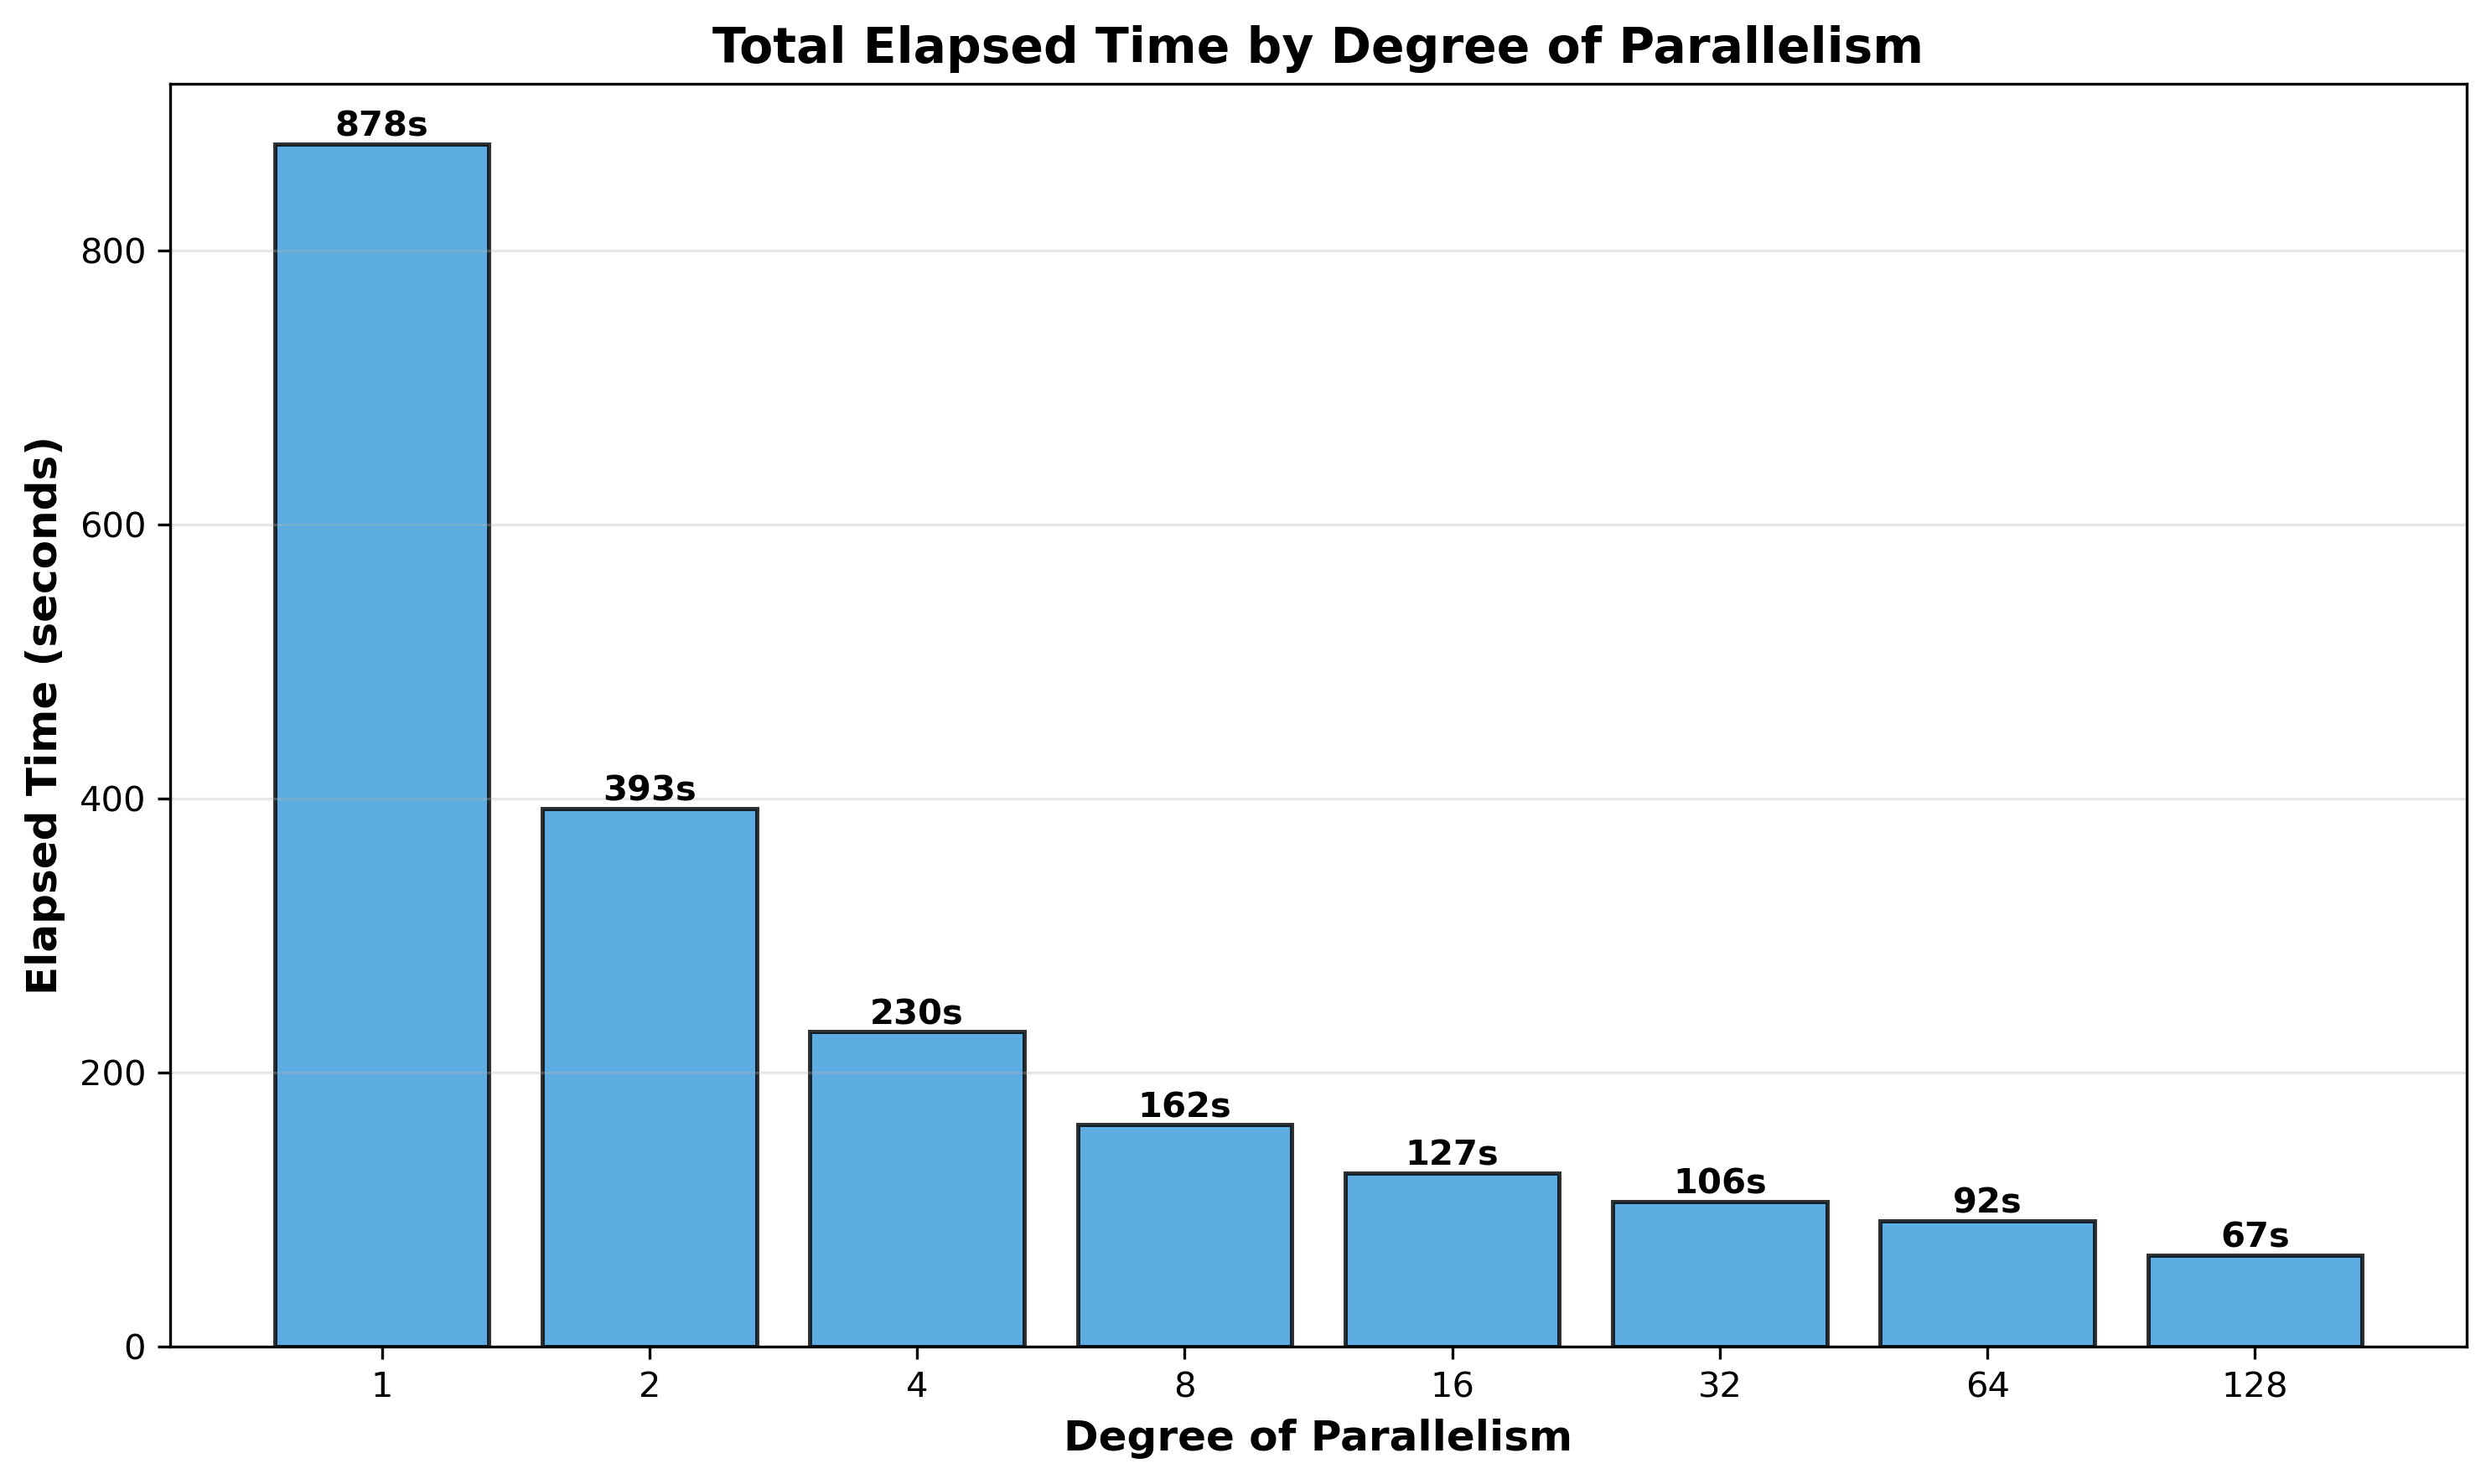
Figure 2: Total Elapsed Time by Degree of Parallelism - Wall-clock time improves continuously across all tested degrees, from 878 seconds (degree 1) to 67 seconds (degree 128). Performance gains remain positive throughout, though the rate of improvement diminishes beyond degree 32 due to increasing lock contention.
Key Findings:
-
Overall Performance: The system achieves consistent performance improvements across all parallelism degrees, with the fastest transfer time of 67 seconds (1.69 GB/s) at degree 128. This represents practical value for production workloads, reducing transfer time from ~15 minutes to just over 1 minute.
-
Target PostgreSQL: Appears to be the primary scaling limitation. System CPU reaches 83.2% at degree 64, meaning only 16.8% of CPU time performs productive work while 83.2% appears spent on lock contention. Interestingly, mean CPU decreases from 4,410% (degree 64) to 3,294% (degree 128) despite doubling parallelism, as network saturation moderates lock contention intensity.
-
FastTransfer: Does not appear to be a bottleneck. Operates with binary COPY protocol (
pgcopymode for both source and target), batch size 1,048,576 rows. Achieves 20.2x speedup with 15.8% efficiency, the best scaling efficiency among all components. -
Source PostgreSQL: Appears to be a victim of backpressure, not an independent bottleneck. At degree 128, 105 processes use only 11.7 cores (0.11 cores/process), suggesting they’re blocked waiting for target acknowledgments rather than actively contending for resources.
-
Network: Saturates at ~2,450 MB/s (98% of capacity) only at degree 128 during active bursts. Degrees 1-64 operate well below capacity, so network doesn’t appear to explain scaling behavior across most of the tested range.
-
Disk: Does not appear to be a bottleneck. Average utilization is only 24.3% at degree 128, with 76% idle capacity remaining.
1. CPU Usage Analysis
1.1 Mean and Peak CPU Usage
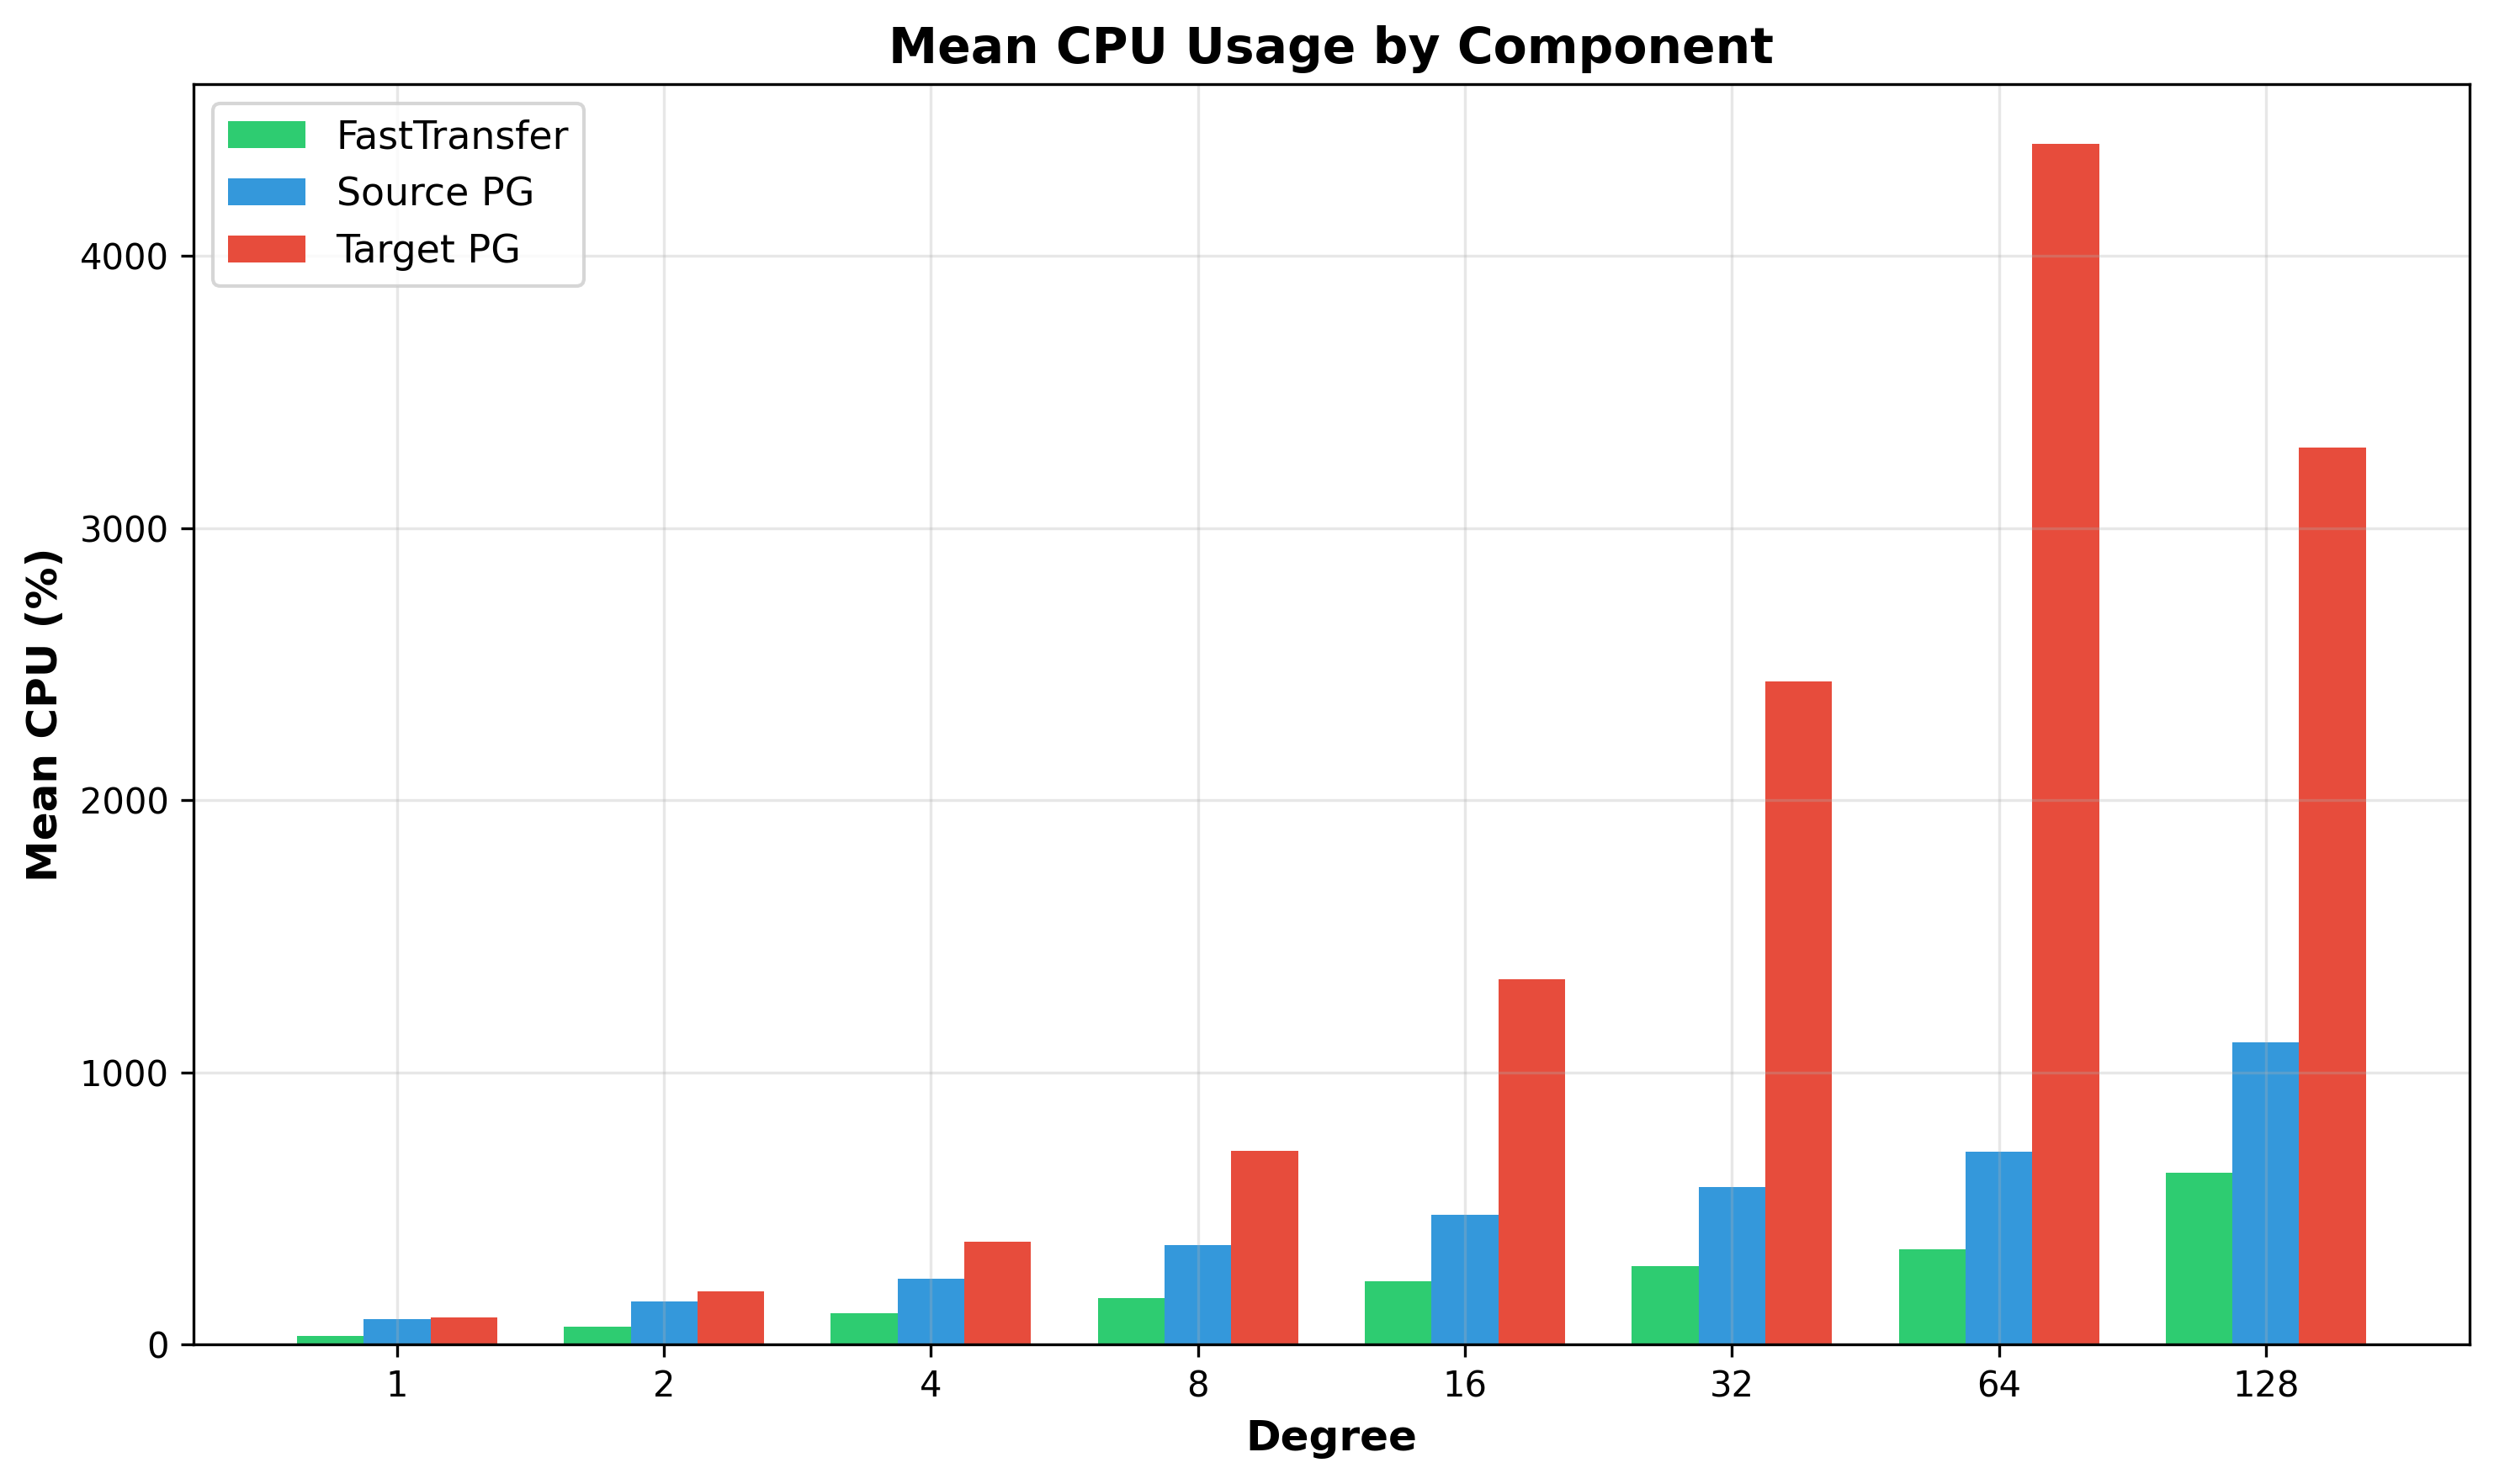
Figure 3: Mean CPU Usage by Component - Target PostgreSQL (red) dominates resource consumption at high parallelism, while source PostgreSQL (blue) reaches around 12 cores.
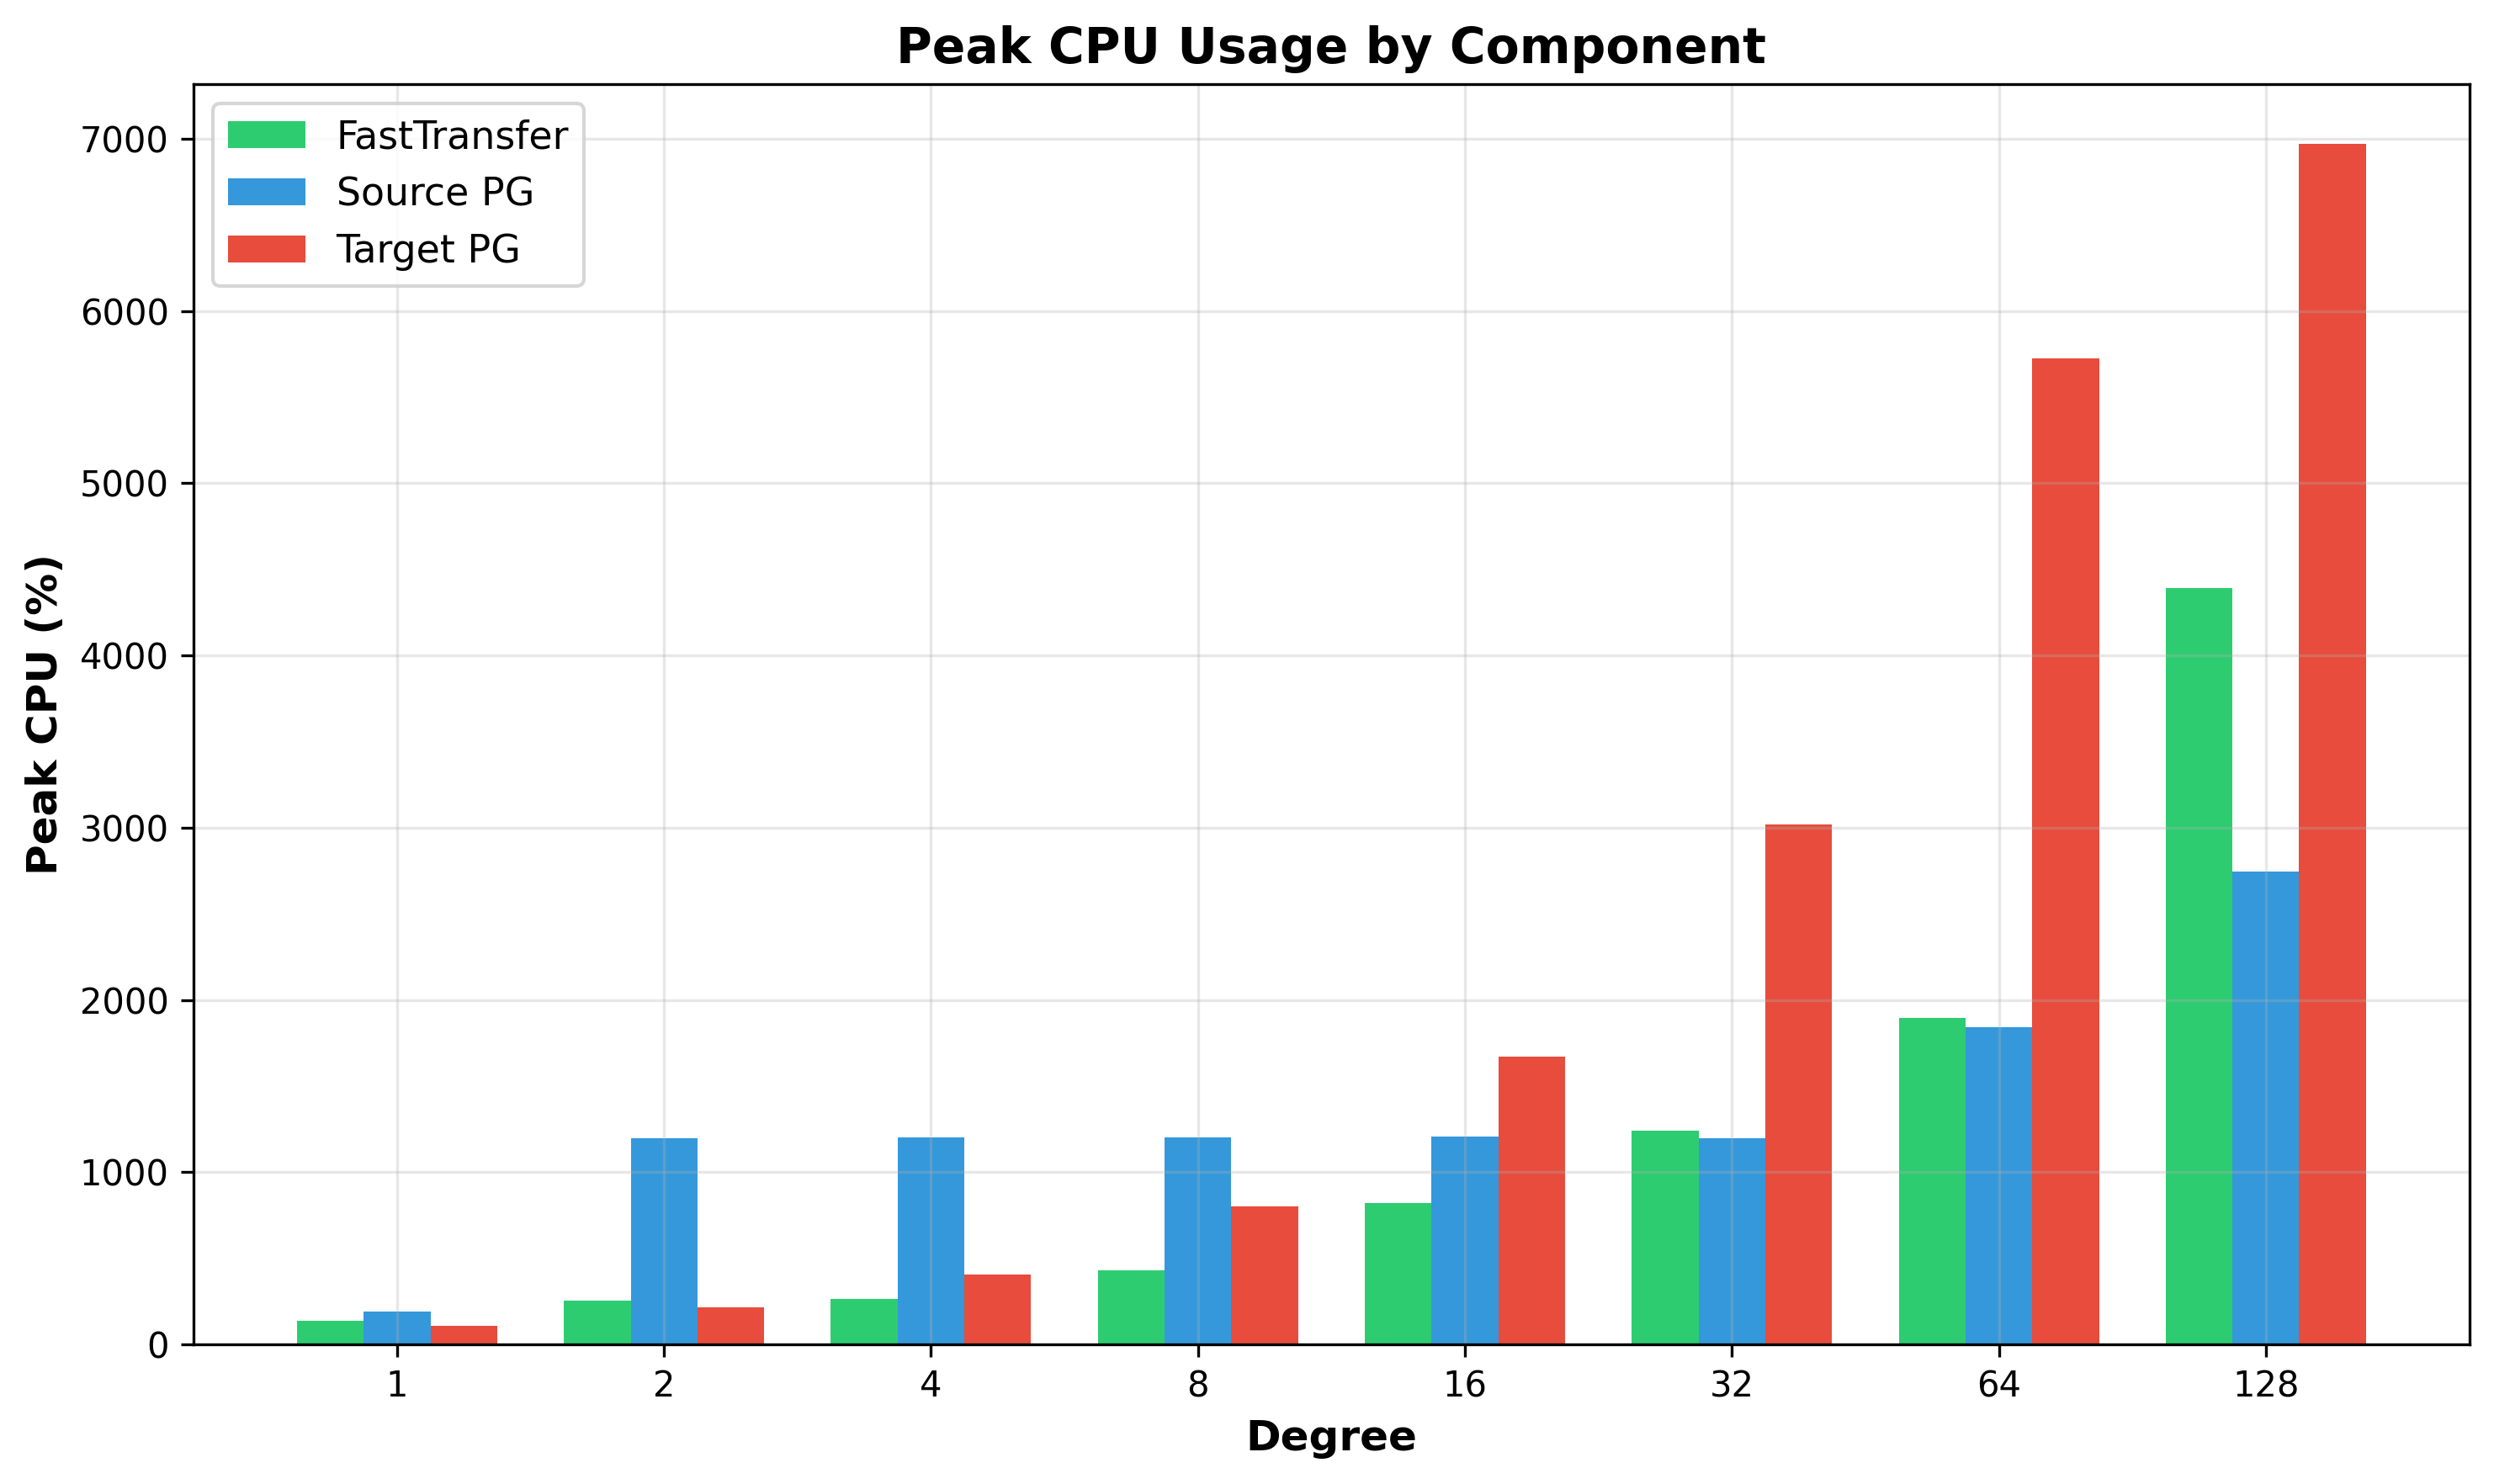
Figure 4: Peak CPU Usage by Component - Target PostgreSQL exhibits extremely high peak values (~6,969% at degree 128). The dramatic spikes combined with relatively lower mean values indicate high variance, characteristic of processes alternating between lock contention and productive work. The variance between peak (~6,969%) and mean (~3,294%) at degree 128 suggests lock queue buildup: processes stall waiting in queues, then burst with intense CPU activity when they finally acquire locks.
Component Scaling Summary:
| Component | Degree 1 | Degree 128 | Speedup | Efficiency |
|---|---|---|---|---|
| Source PostgreSQL | 93% (0.93 cores) | 1,110% (11.1 cores) | 11.9x | 9.3% |
| FastTransfer | 31% (0.31 cores) | 631% (6.3 cores) | 20.1x | 15.7% |
| Target PostgreSQL | 98% (0.98 cores) | 3,294% (32.9 cores) | 33.6x | 26.3% |
Source PostgreSQL’s poor scaling appears to stem from backpressure: FastTransfer’s batch-and-wait protocol (1,048,576 rows/batch) means source processes send a batch, then block waiting for target acknowledgment. When the target cannot consume data quickly due to lock contention, this delay propagates backward. At degree 128, 105 source processes collectively use only 11.7 cores (0.11 cores/process), suggesting they’re waiting rather than actively working.
1.2 FastTransfer Architecture
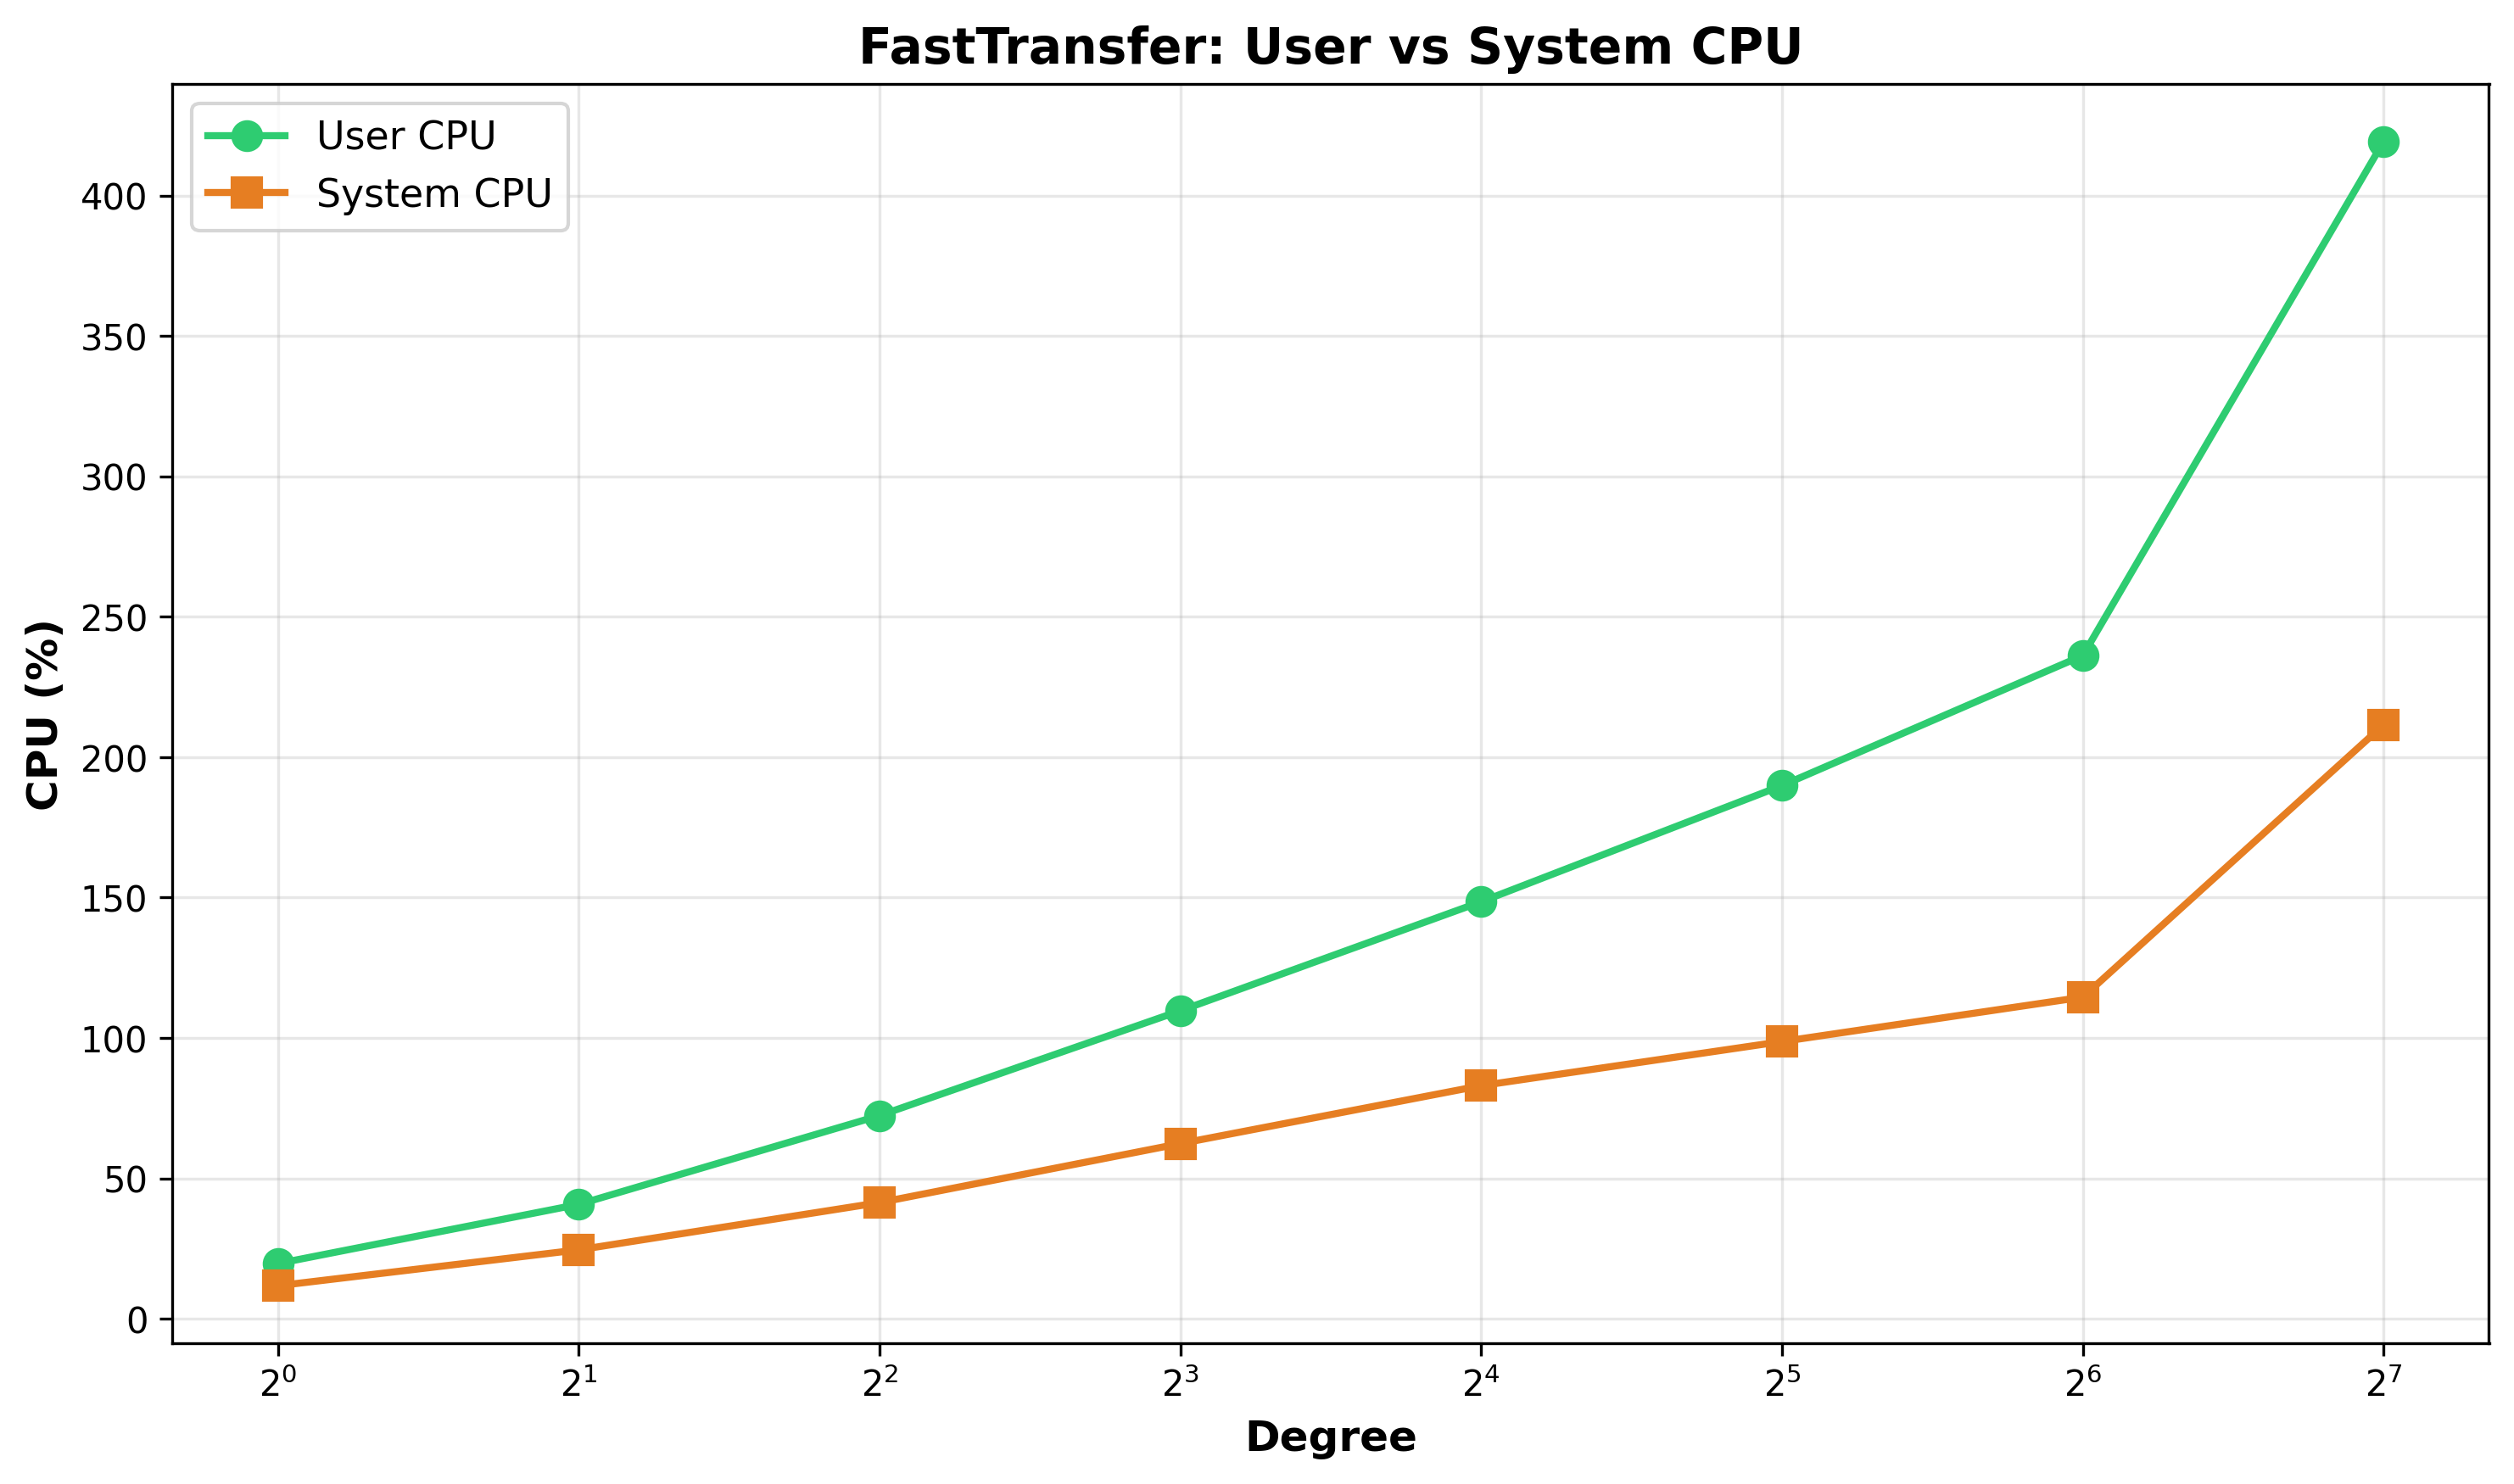
Figure 5: FastTransfer User vs System CPU - At degree 128, FastTransfer uses 419% user CPU (66%) and 212% system CPU (34%). The system CPU proportion is appropriate for network I/O intensive applications.
FastTransfer uses PostgreSQL’s binary COPY protocol for both source and target (--sourceconnectiontype "pgcopy" and --targetconnectiontype "pgcopy"). Data flows directly from source PostgreSQL’s COPY TO BINARY through FastTransfer to target PostgreSQL’s COPY FROM BINARY without data transformation. FastTransfer acts as an intelligent network proxy coordinating parallel streams and batch acknowledgments, explaining its relatively low CPU usage.
1.3 Process Counts and CPU Efficiency
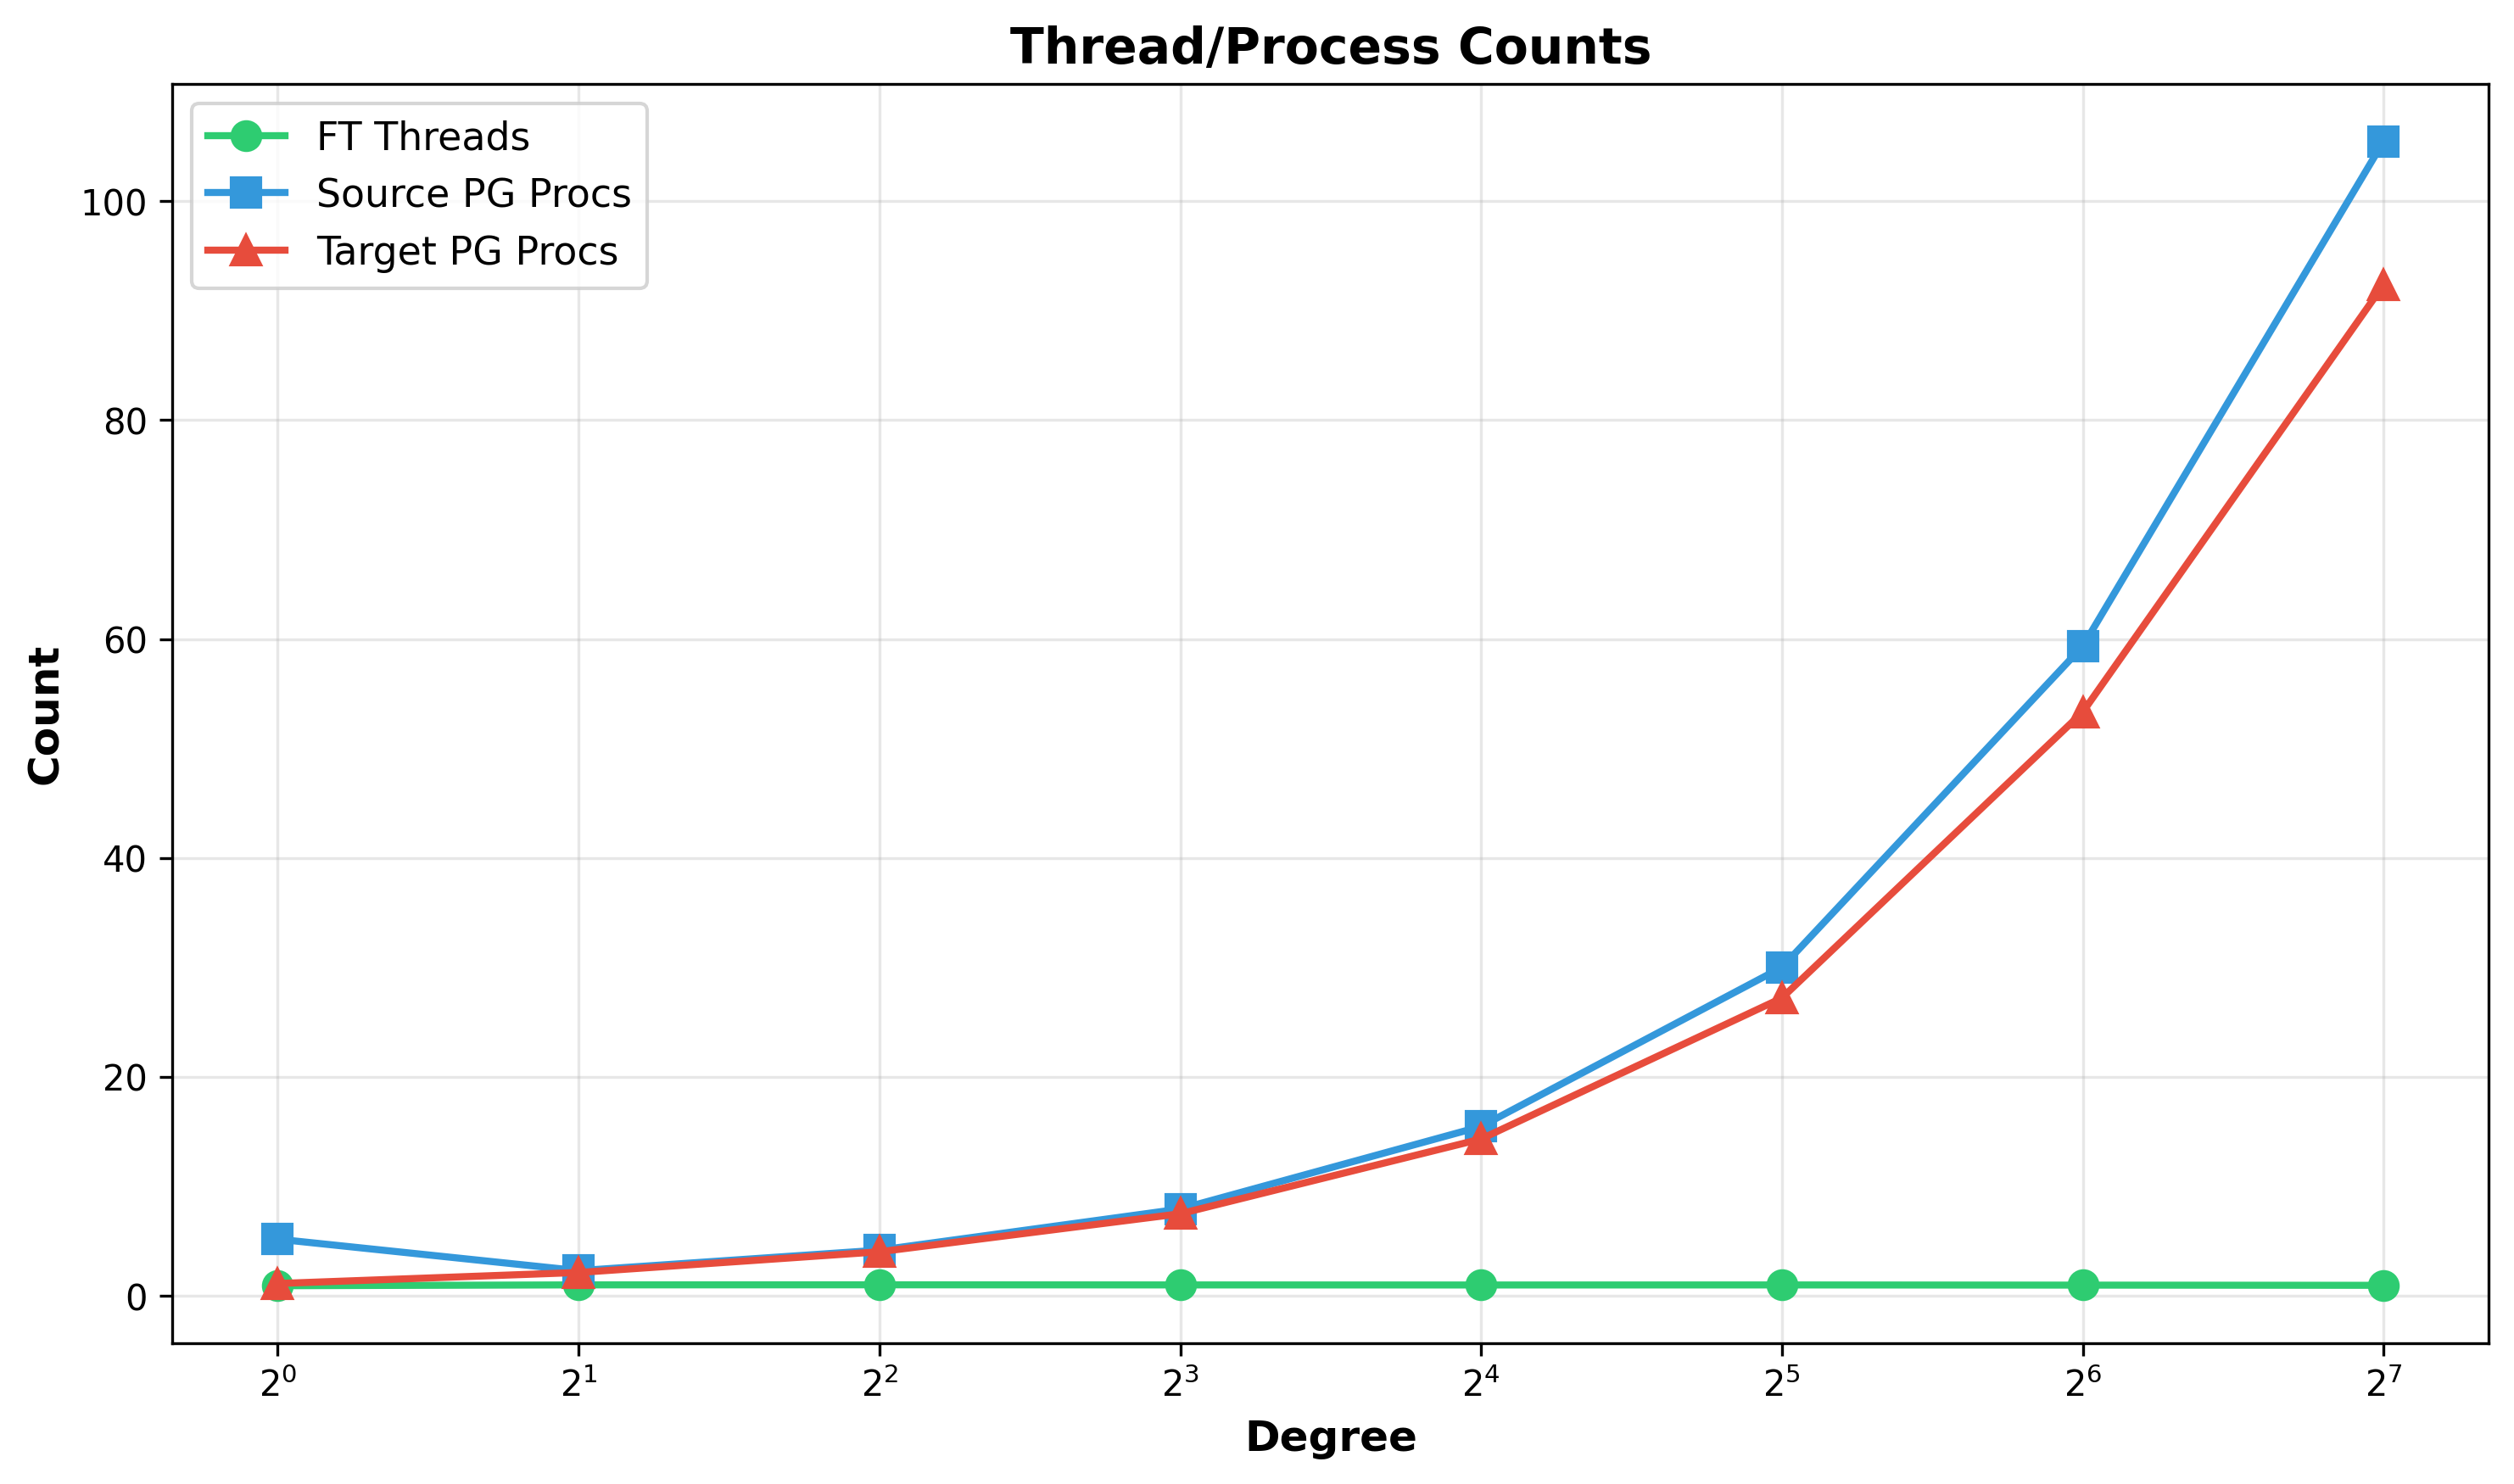
Figure 6: Thread/Process Counts - FastTransfer (green) maintains 1 process across all degrees using internal threading. PostgreSQL components (blue=source, red=target) scale linearly with their process-per-connection model. At degree 128, source spawns 105 processes, target spawns 88 processes.
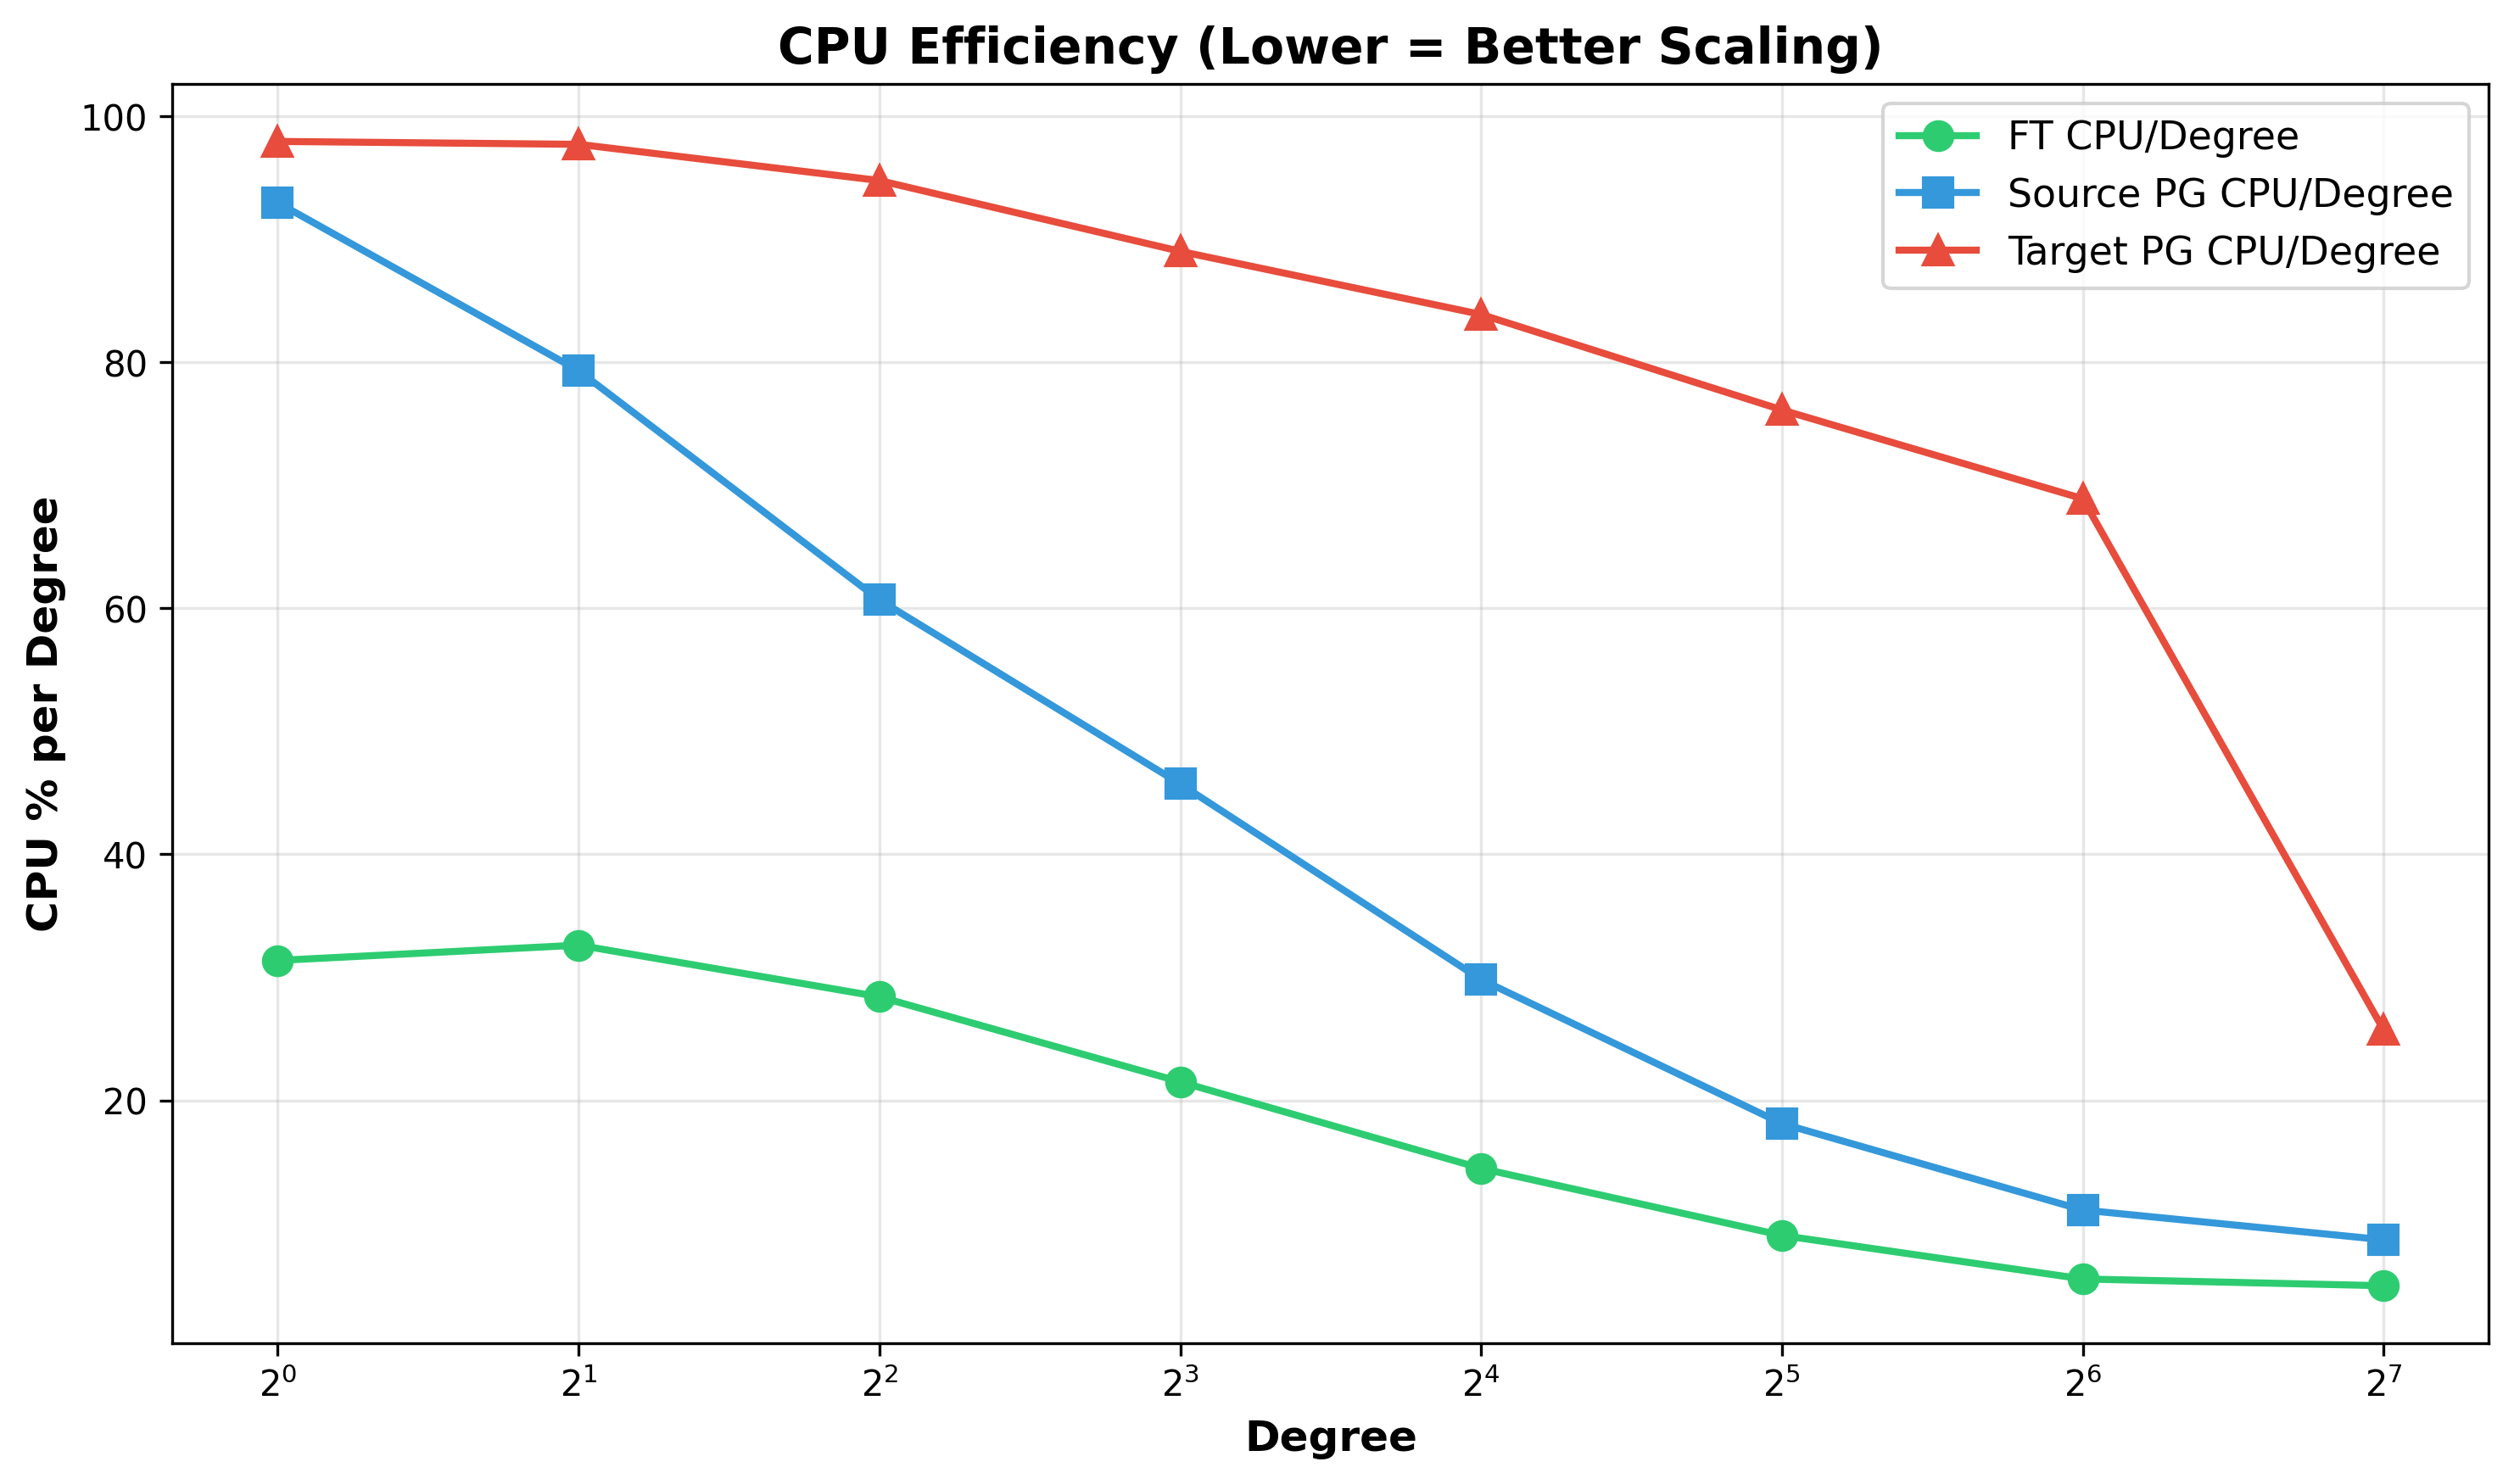
Figure 7: CPU Efficiency (CPU per Degree) - Lower values indicate better scaling. Source PostgreSQL (blue) drops significantly from 93% at degree 1 to 8.7% at degree 128, indicating processes spend most time waiting rather than working due to backpressure. Target PostgreSQL (red) drops from 69% at degree 64 to 26% at degree 128, reflecting reduced CPU utilization per worker despite achieving the best absolute performance (67s elapsed time).
2. The Lock Contention Problem: System CPU Analysis
2.1 System CPU
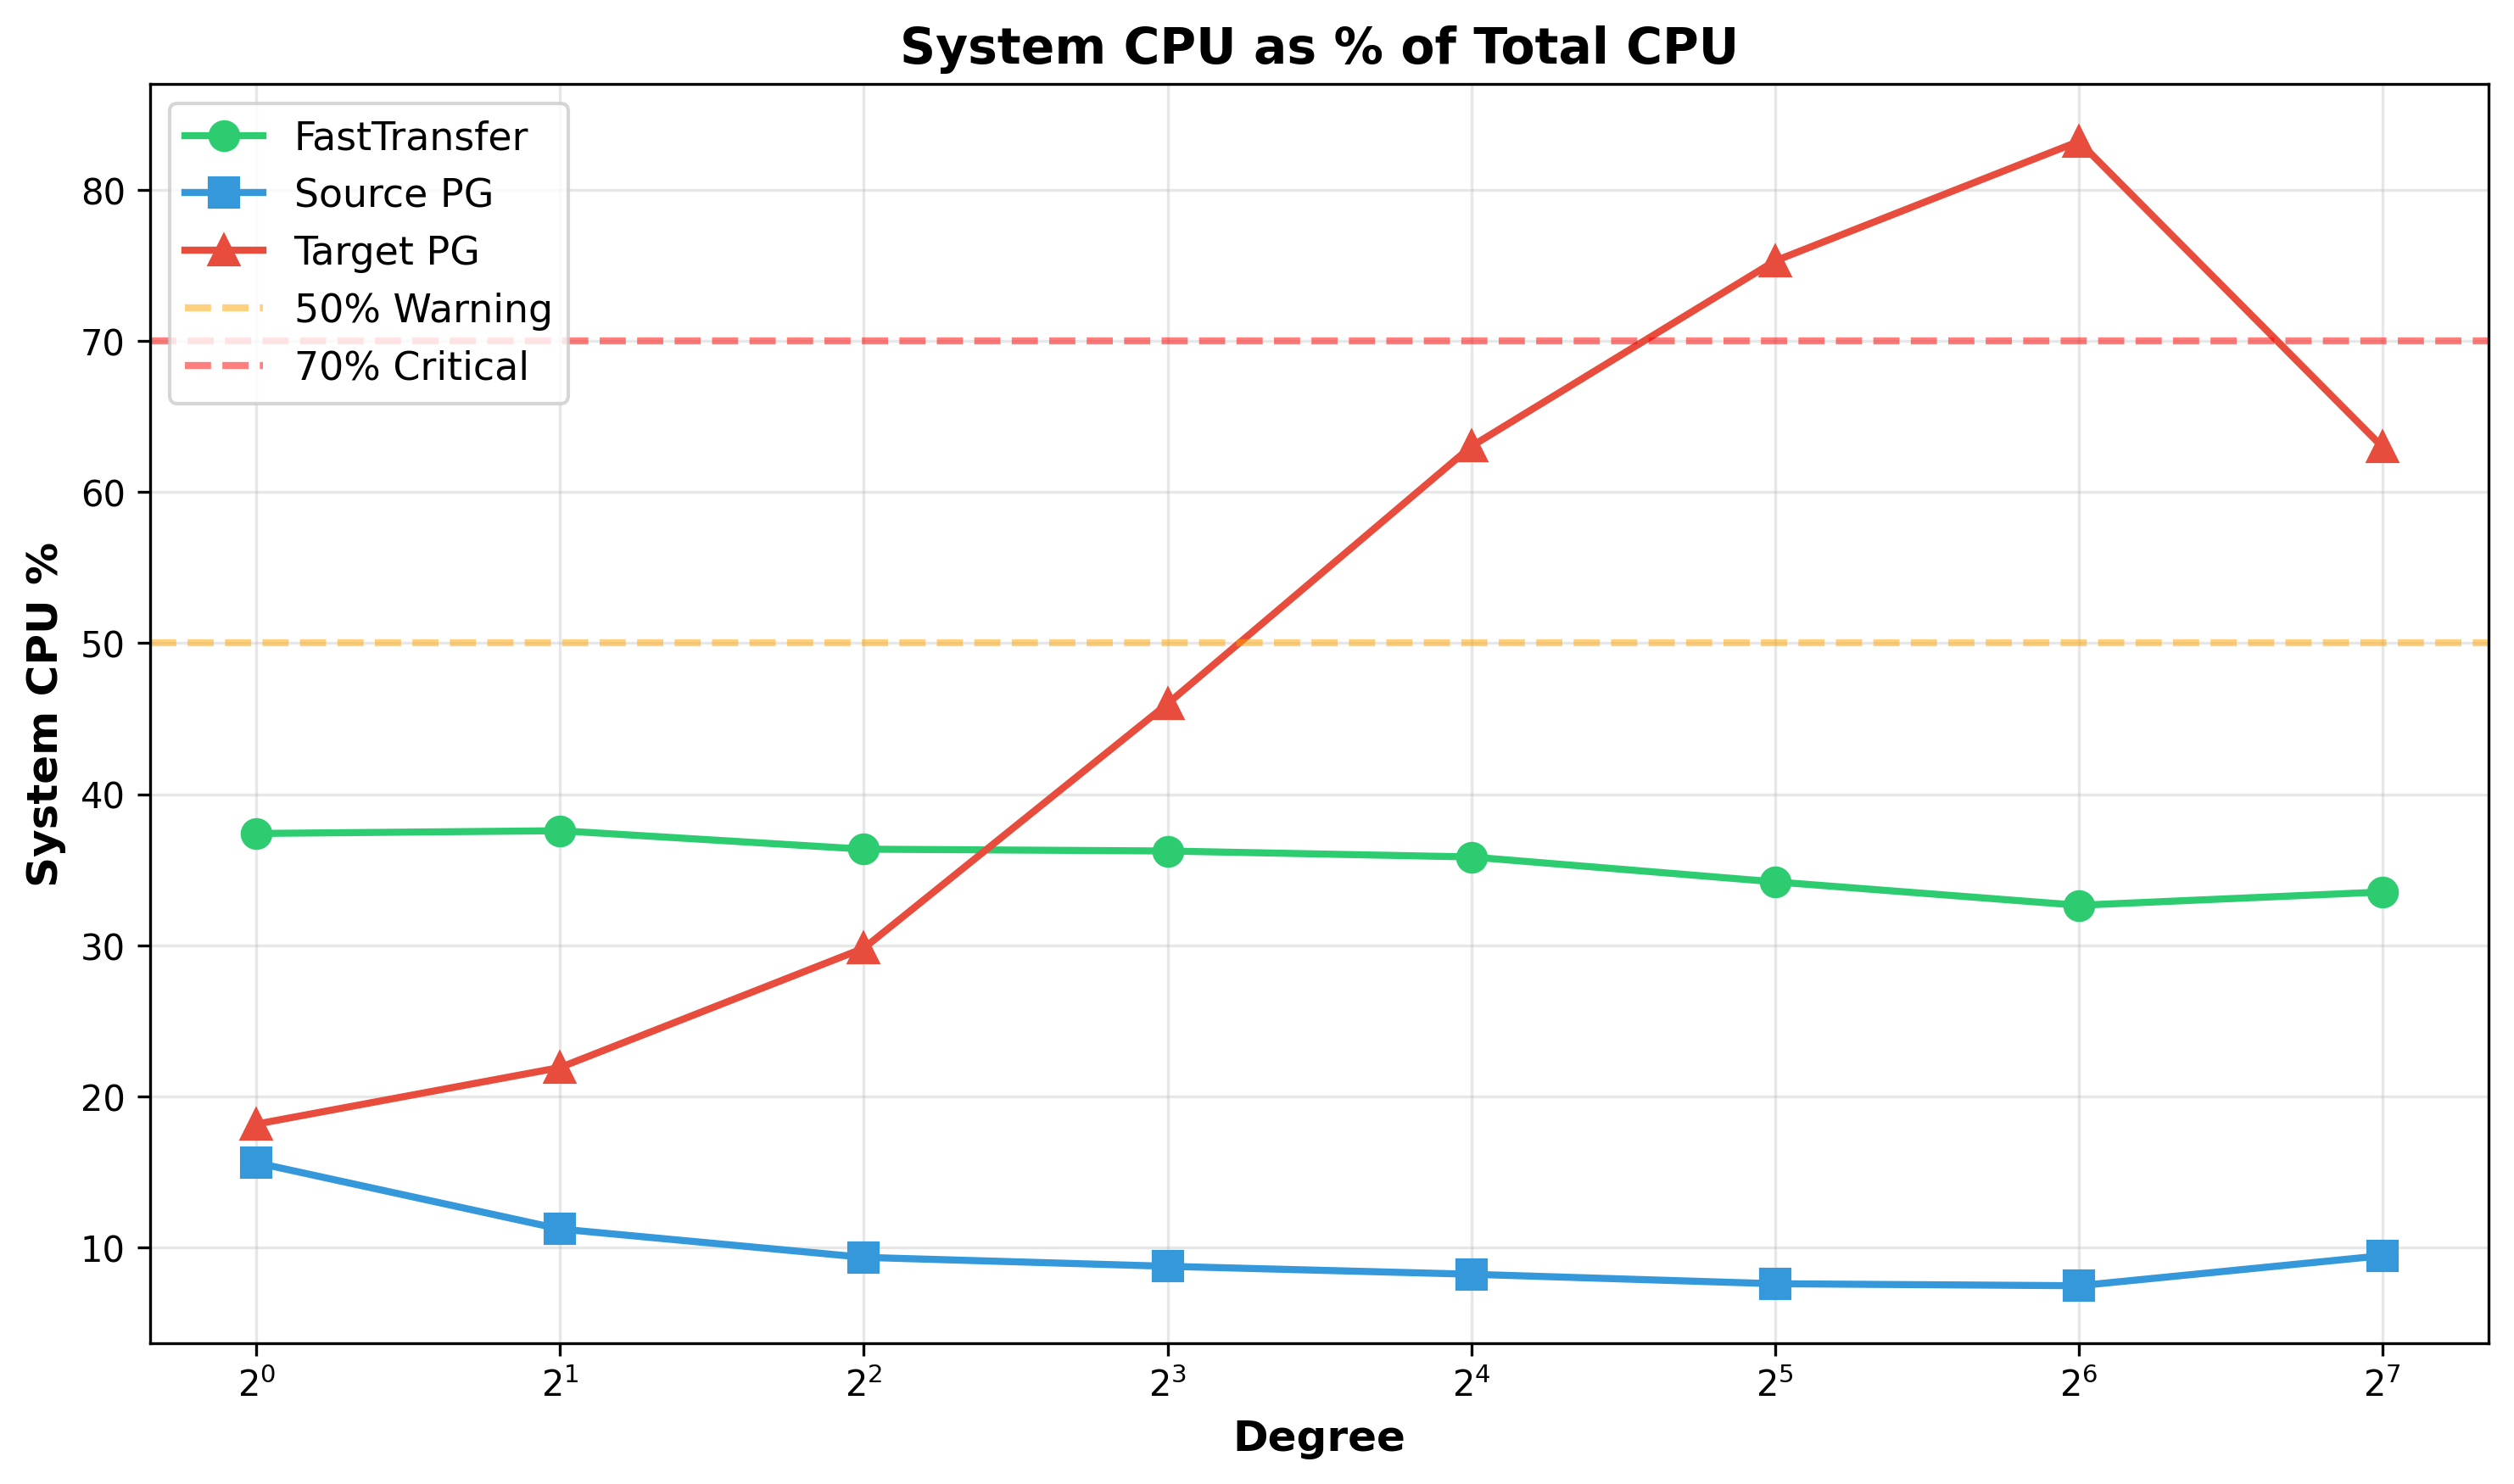
Figure 8: System CPU as % of Total CPU - Target PostgreSQL (red line) crosses the 50% warning threshold at degree 16, exceeds 70% critical threshold at degree 32, and peaks at 83.2% at degree 64. At this maximum, only 16.8% of CPU time performs productive work while 83.2% appears spent on lock contention and kernel overhead.
CPU time divides into two categories: User CPU (application code performing actual data insertion) and System CPU (kernel operations handling locks, synchronization, context switches, I/O). A healthy system maintains system CPU below 30%.
System CPU Progression:
| Degree | Total CPU | User CPU | System CPU | System % | Productive Work |
|---|---|---|---|---|---|
| 1 | 98% | 80% | 18% | 18.2% | Healthy baseline |
| 16 | 1,342% | 496% | 846% | 63.0% | Warning threshold crossed |
| 32 | 2,436% | 602% | 1,834% | 75.3% | Critical contention |
| 64 | 4,410% | 741% | 3,670% | 83.2% | Maximum contention |
| 128 | 3,294% | 1,219% | 2,075% | 63.0% | Warning threshold crossed |
At degree 64, processes appear to spend 83.2% of time managing locks rather than inserting data. By degree 128, total CPU actually decreases despite doubled parallelism, suggesting the system cannot fully utilize additional workers due to excessive contention.
2.2 Root Causes of Lock Contention
The target table was already optimized for bulk loading (UNLOGGED, no indexes, no constraints, no triggers), eliminating all standard overhead sources. The remaining contention appears to stem from PostgreSQL’s fundamental architecture:
-
Shared Buffer Pool Locks: All 128 parallel connections compete for buffer pool partition locks to read/modify/write pages. PostgreSQL’s buffer manager has inherent limitations for concurrent write parallelism.
-
Relation Extension Locks: When the table grows, PostgreSQL requires an exclusive lock (only one process at a time).
-
Free Space Map (FSM) Locks: All 128 writers query and update the FSM to find pages with free space, creating constant FSM thrashing.
3. Distribution and Time Series Analysis
3.1 CPU Distribution
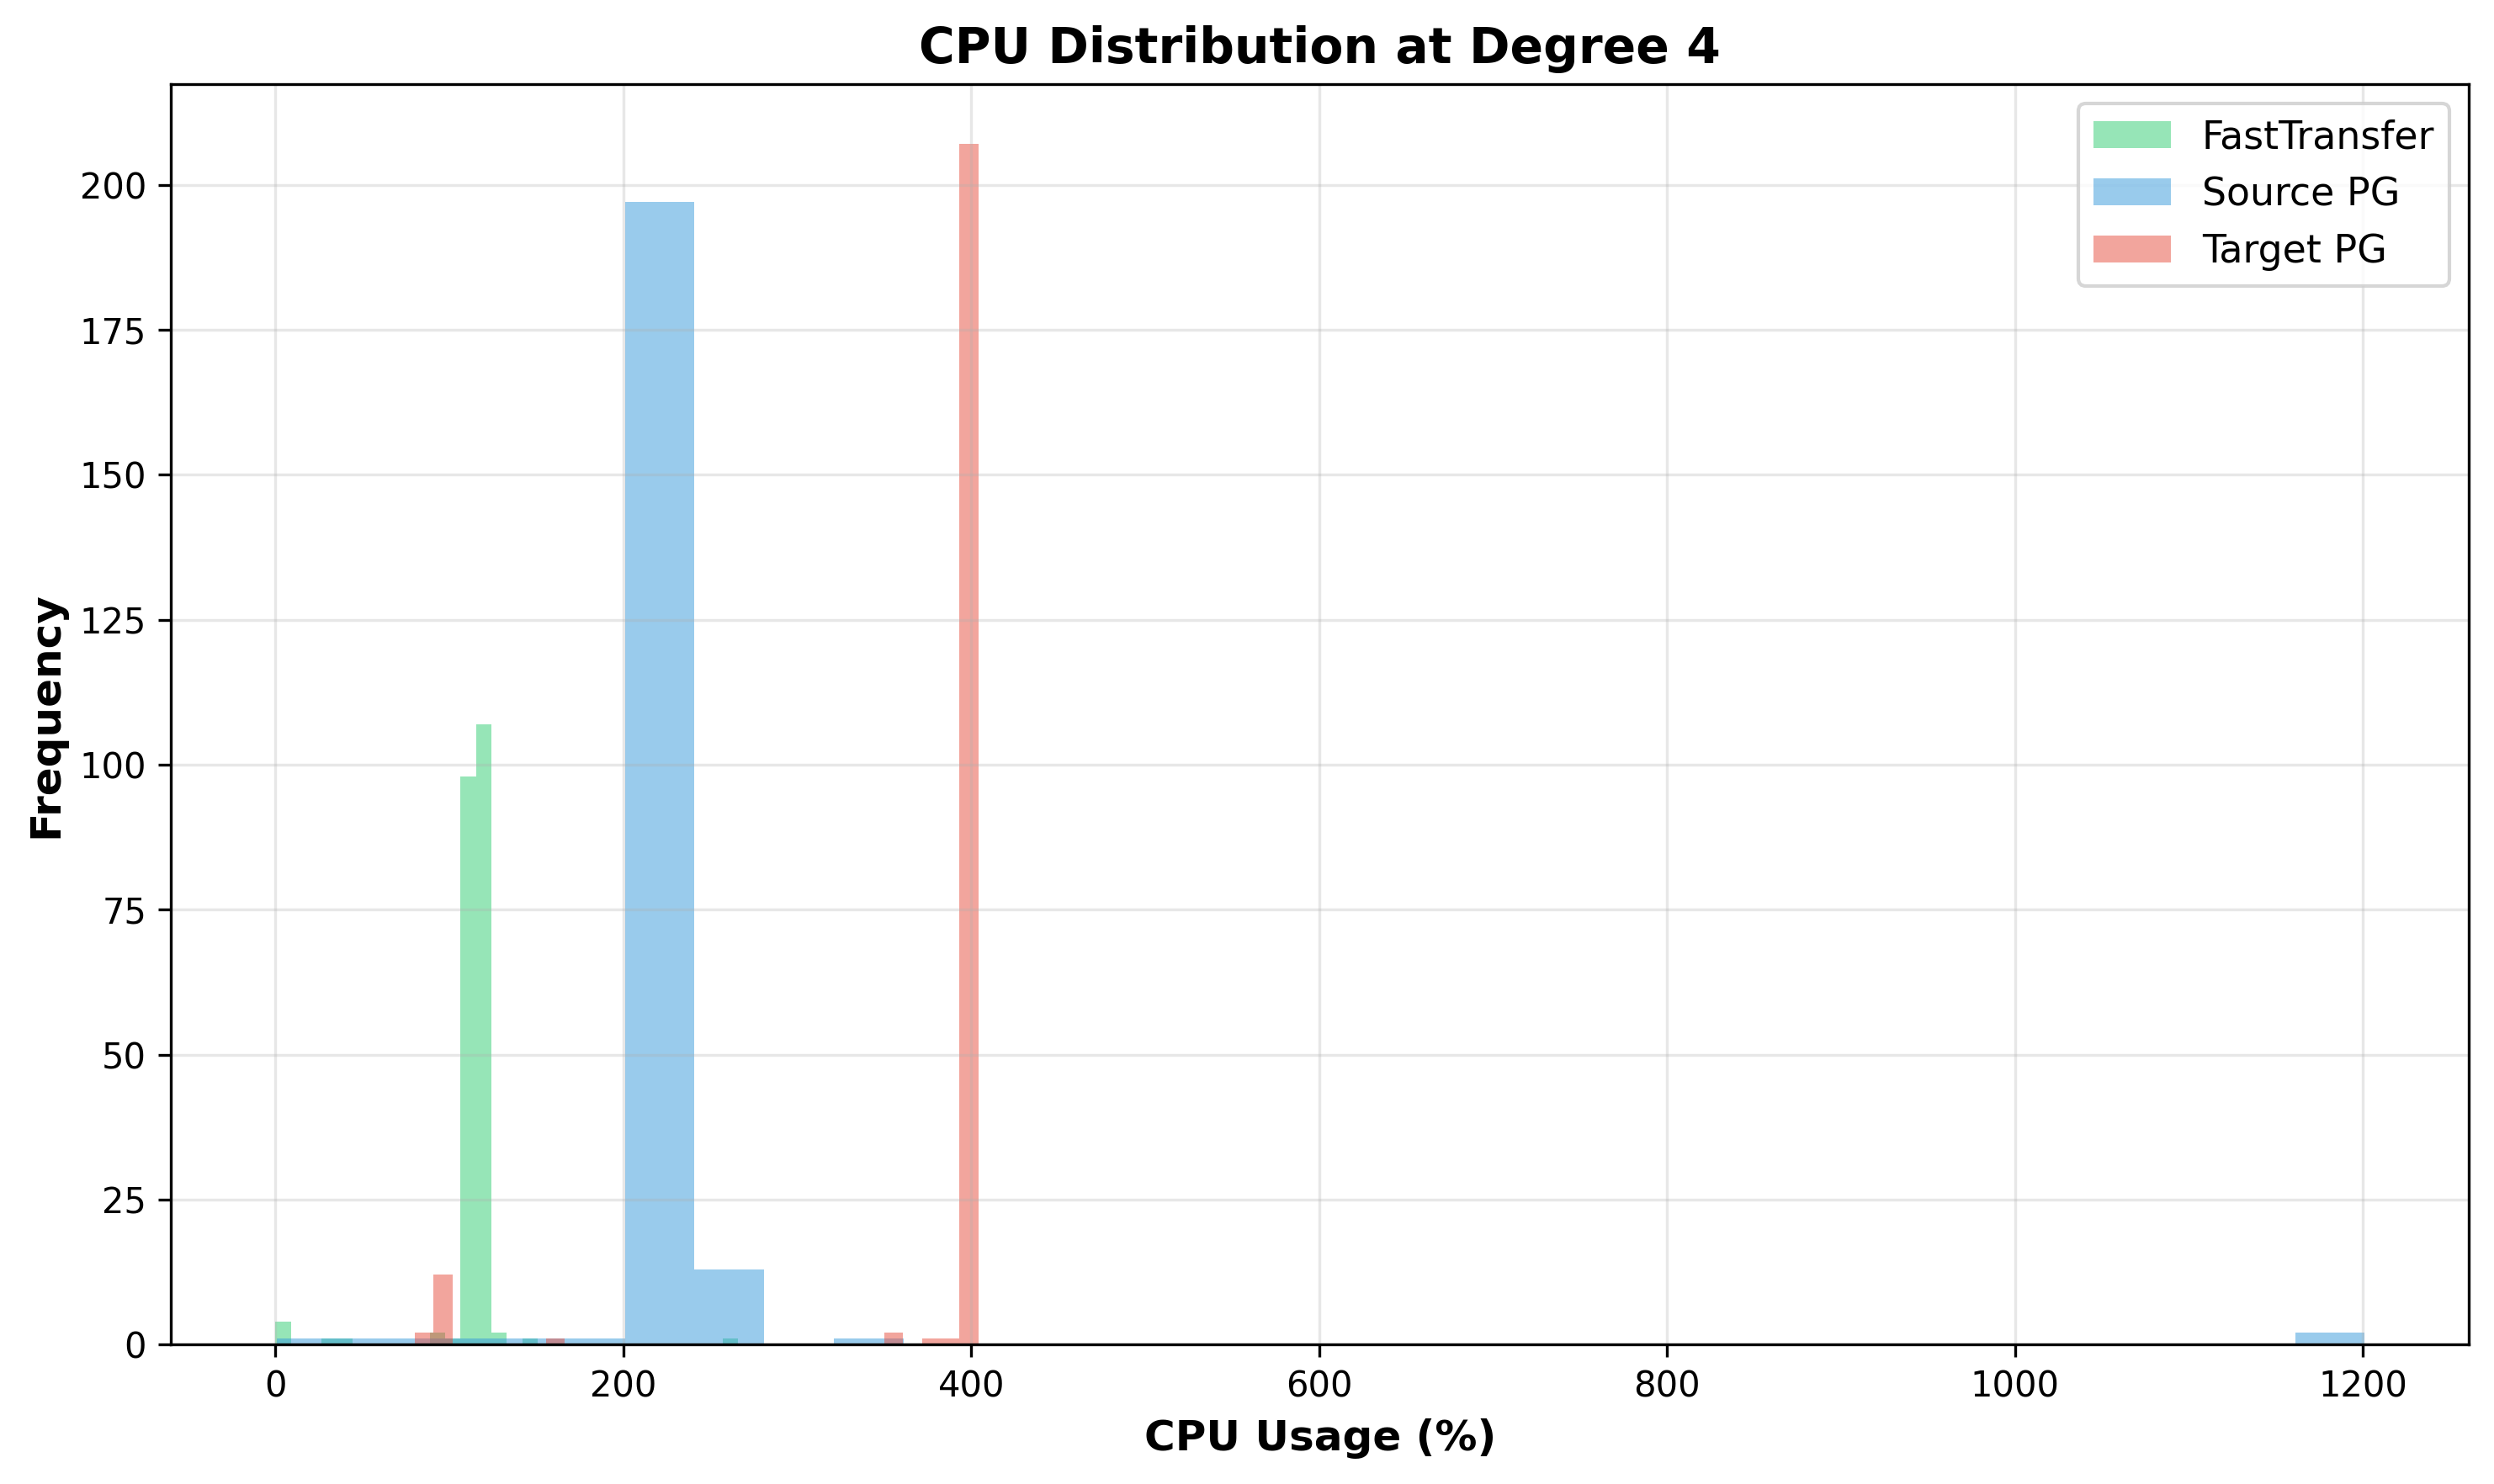
Figure 9: CPU Distribution at Degree 4 - Tight, healthy distributions with small standard deviations. All components operate consistently without significant contention.
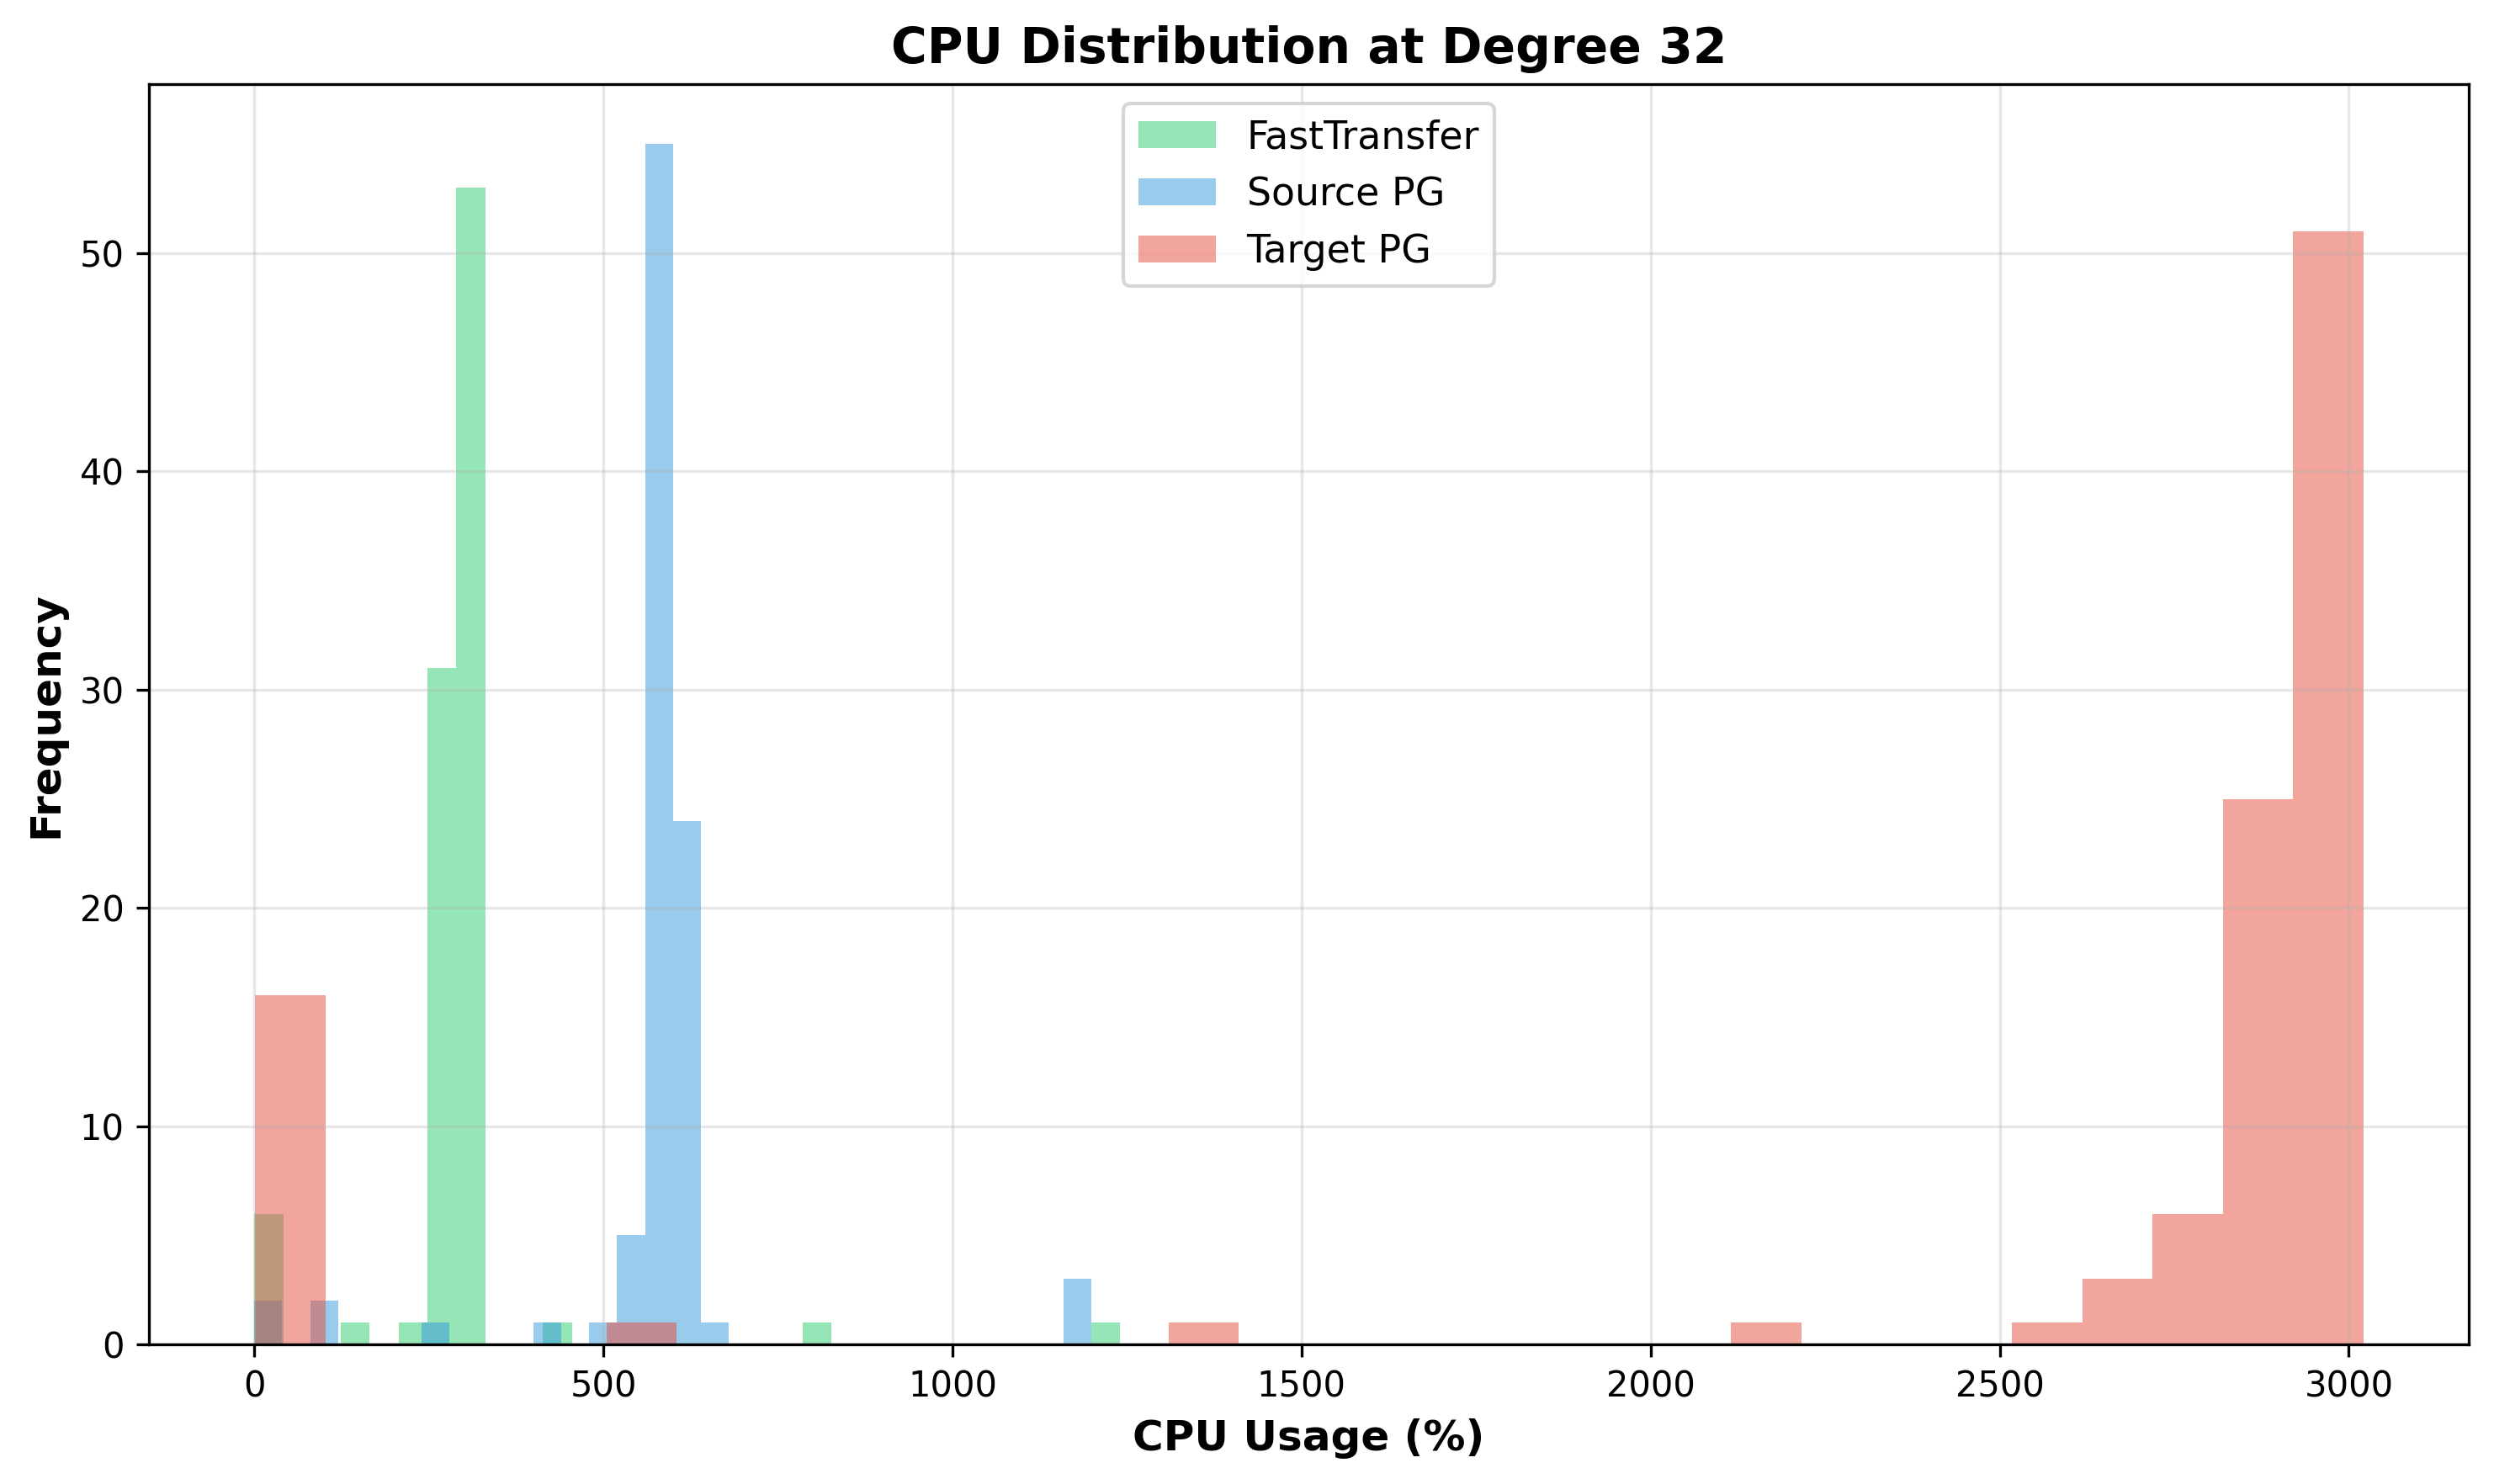
Figure 10: CPU Distribution at Degree 32 - Target PostgreSQL (red) becomes bimodal with wide spread (1000-3000% range), indicating some samples capture waiting processes while others capture active processes. Source (blue) remains relatively tight.
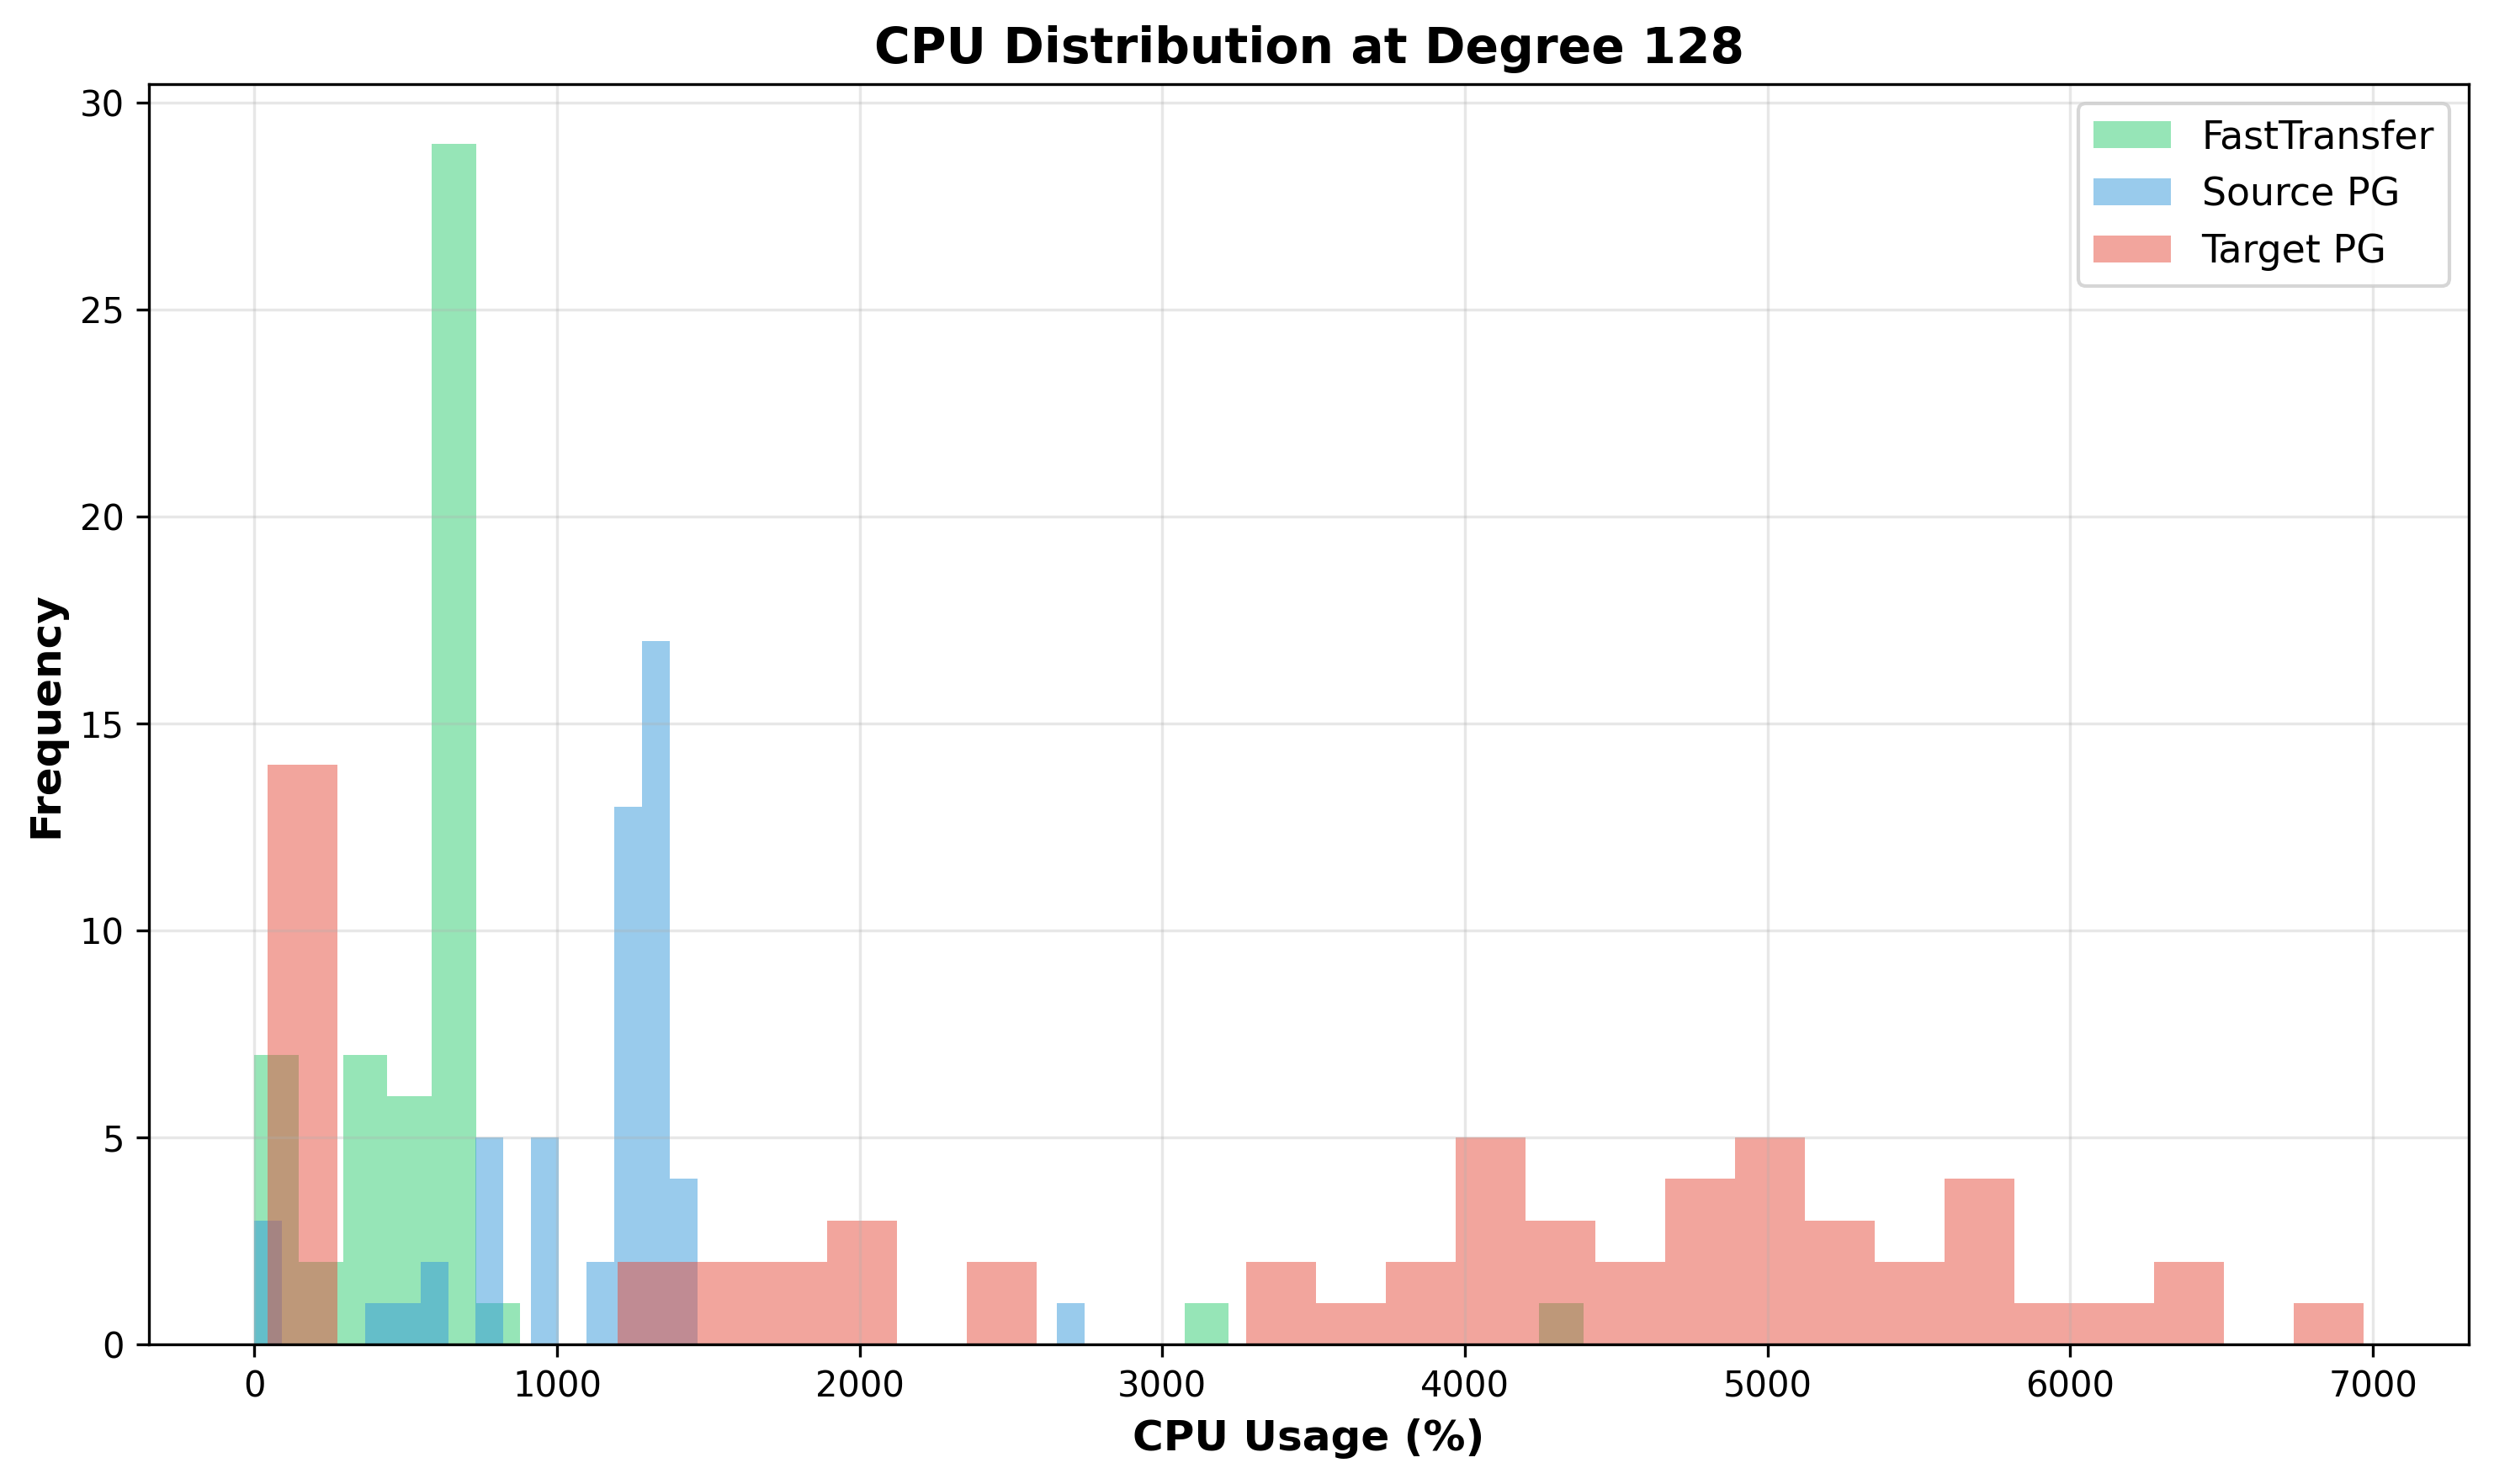
Figure 11: CPU Distribution at Degree 128 - Target PostgreSQL (red) spans nearly 0-10000%, indicating highly variable behavior. Some processes are nearly starved (near 0%) while others burn massive CPU on lock spinning (>8000%). This pathological distribution suggests severe lock thrashing.
3.2 CPU Time Series
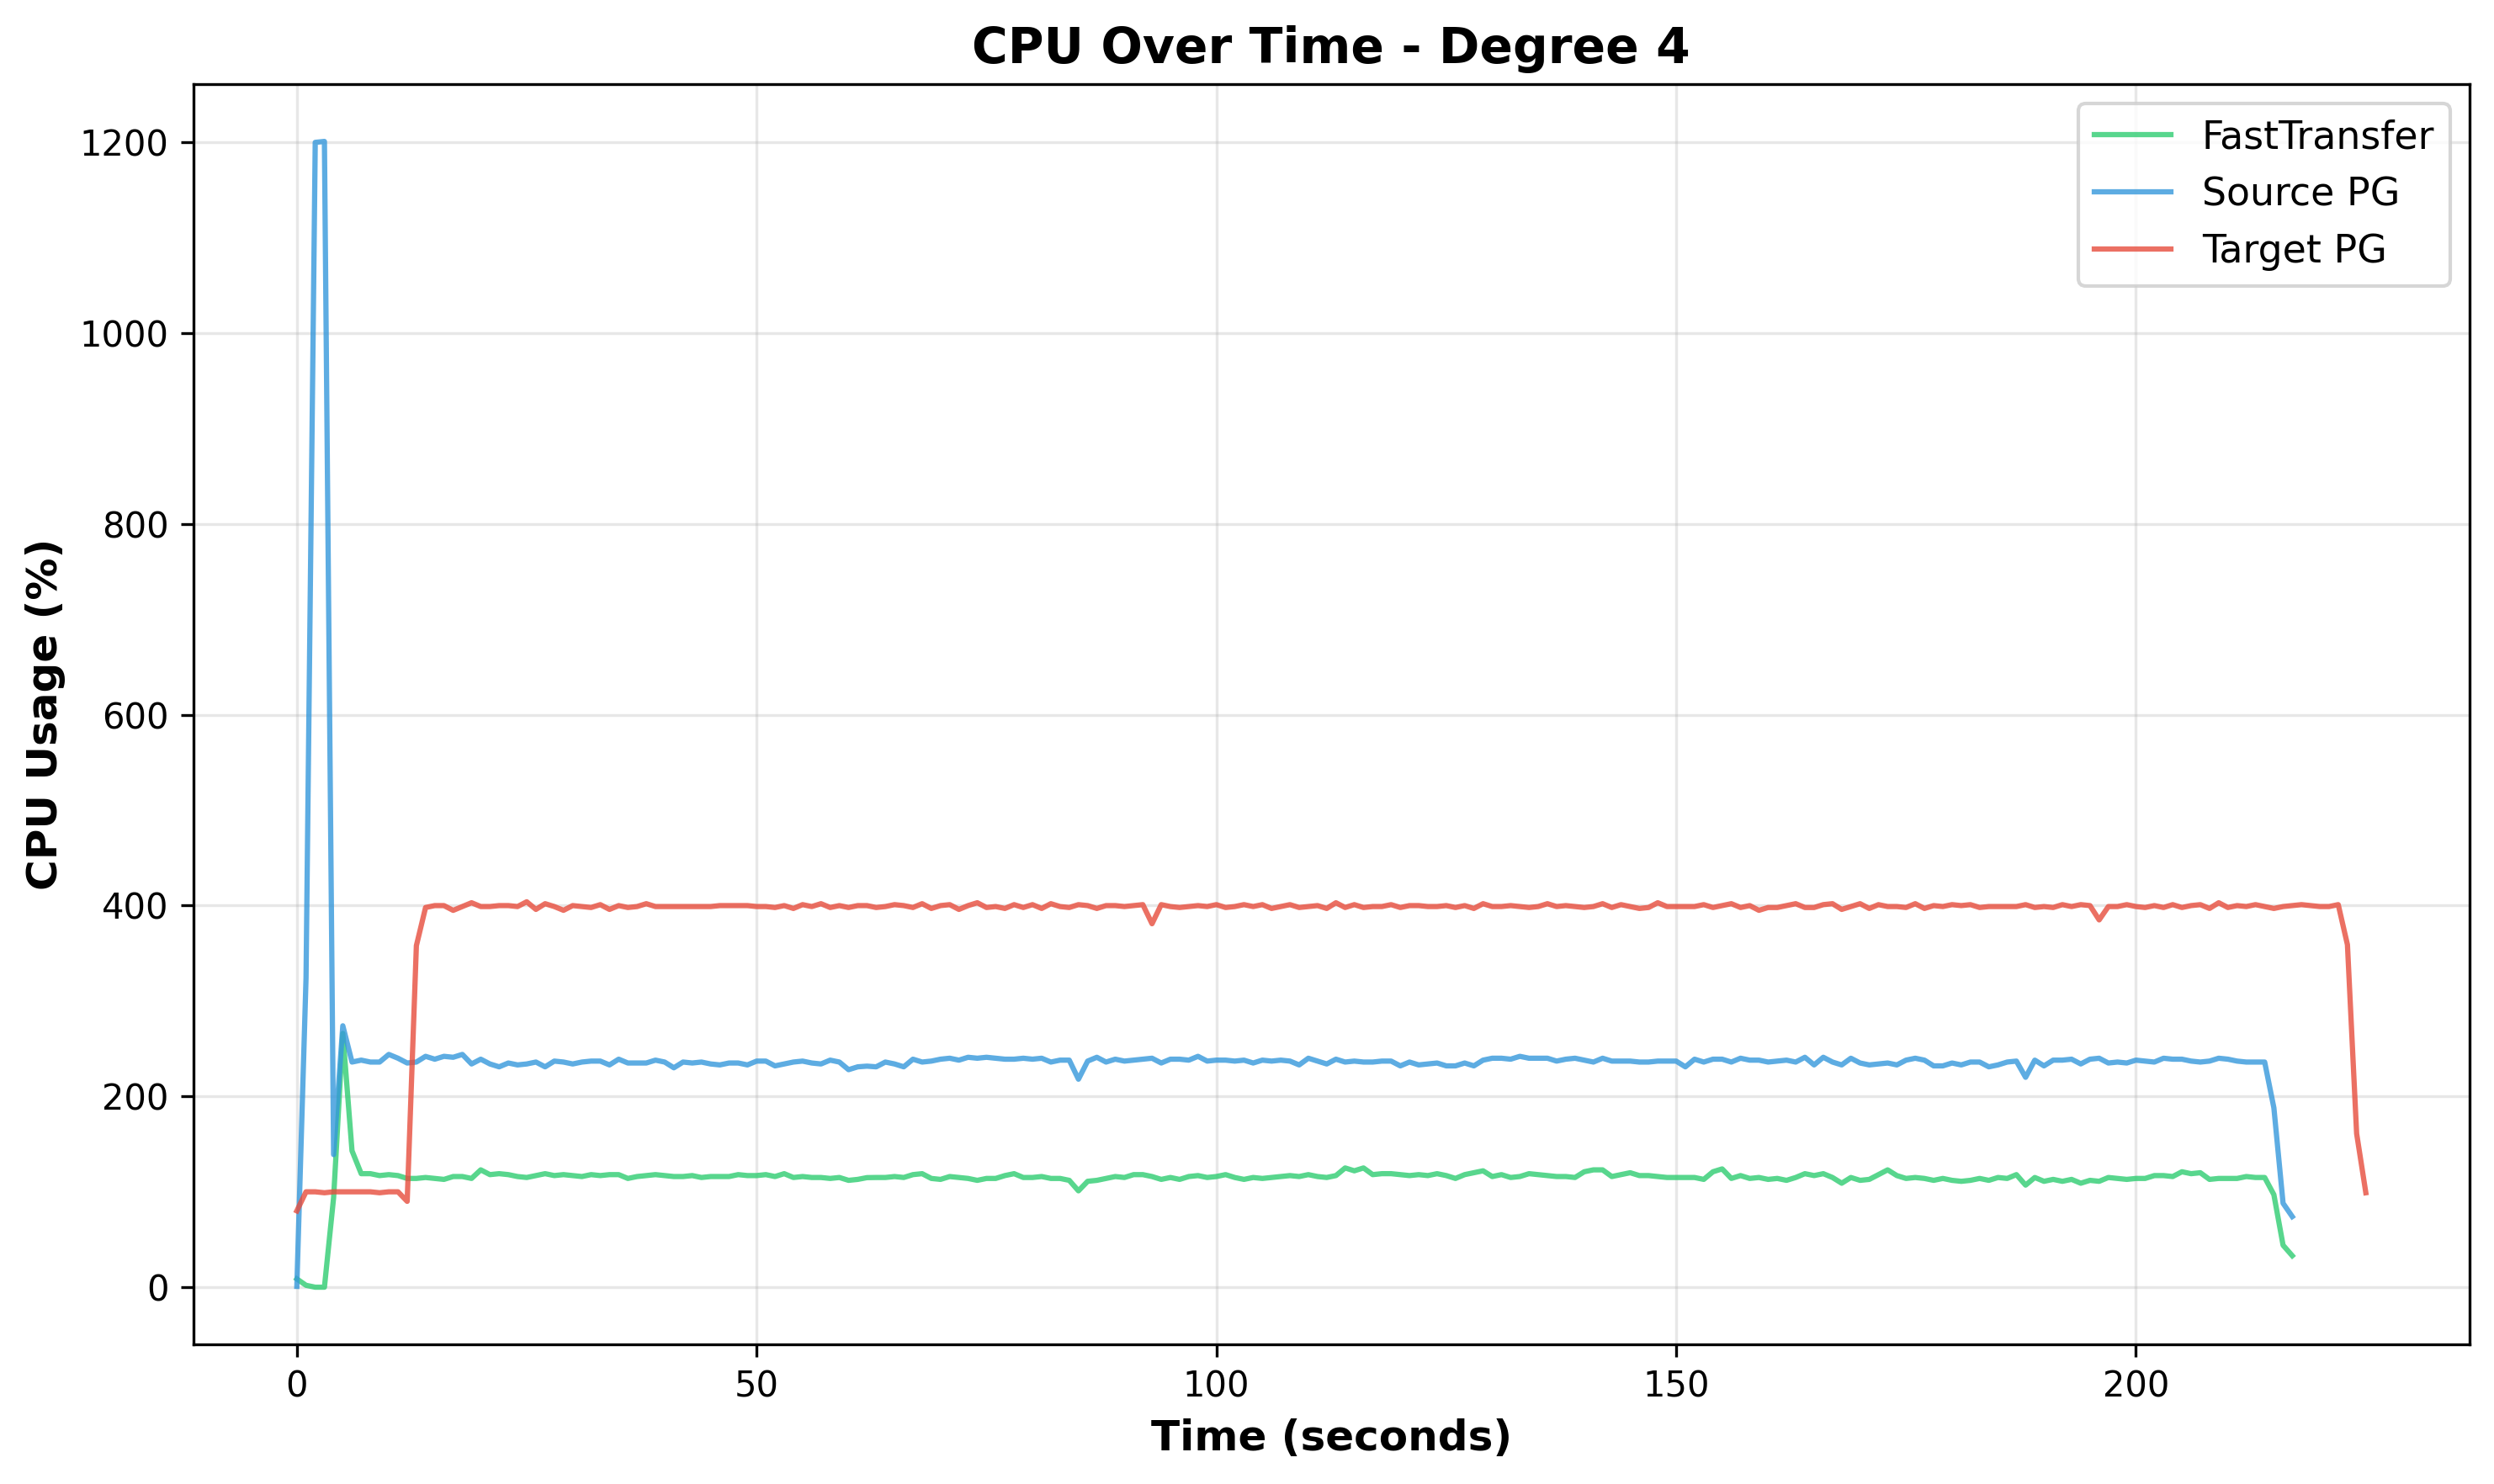
Figure 12: CPU Over Time at Degree 4 - All components show stable, smooth CPU usage with minimal oscillations throughout the test duration.
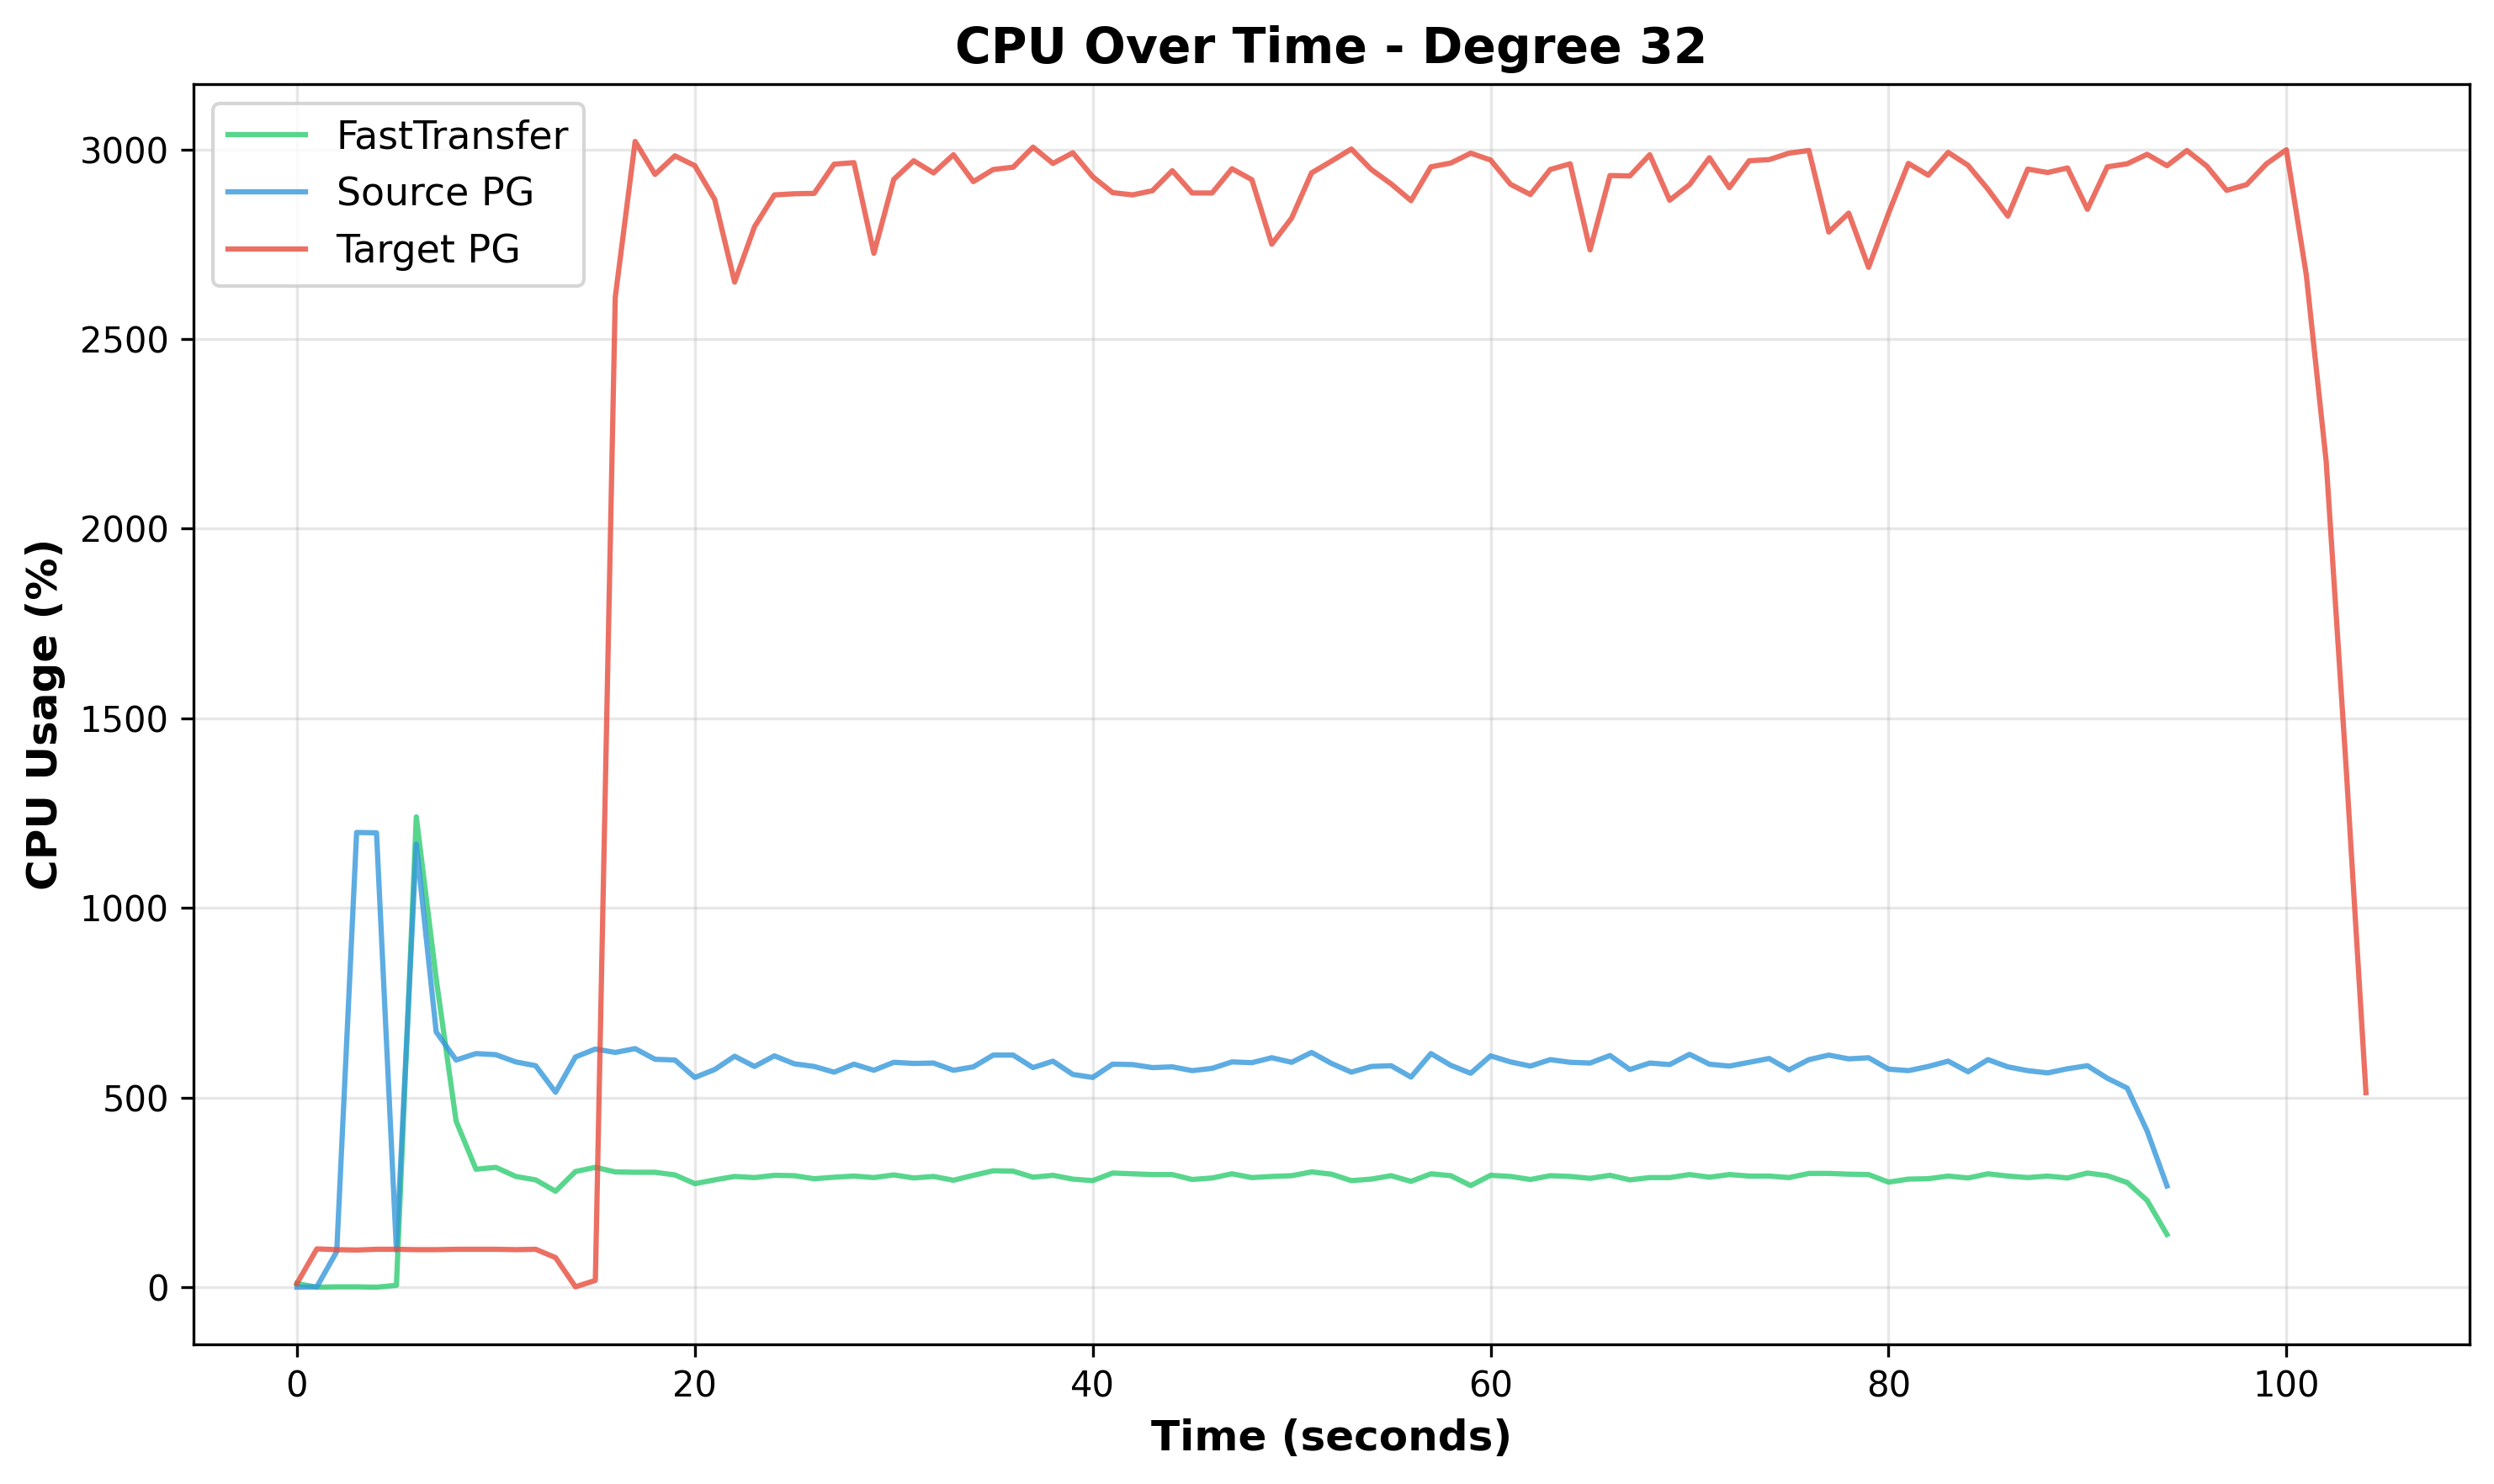
Figure 13: CPU Over Time at Degree 32 - Target PostgreSQL (red) shows increasing variability and oscillations, indicating periods of successful lock acquisition alternating with blocking periods.
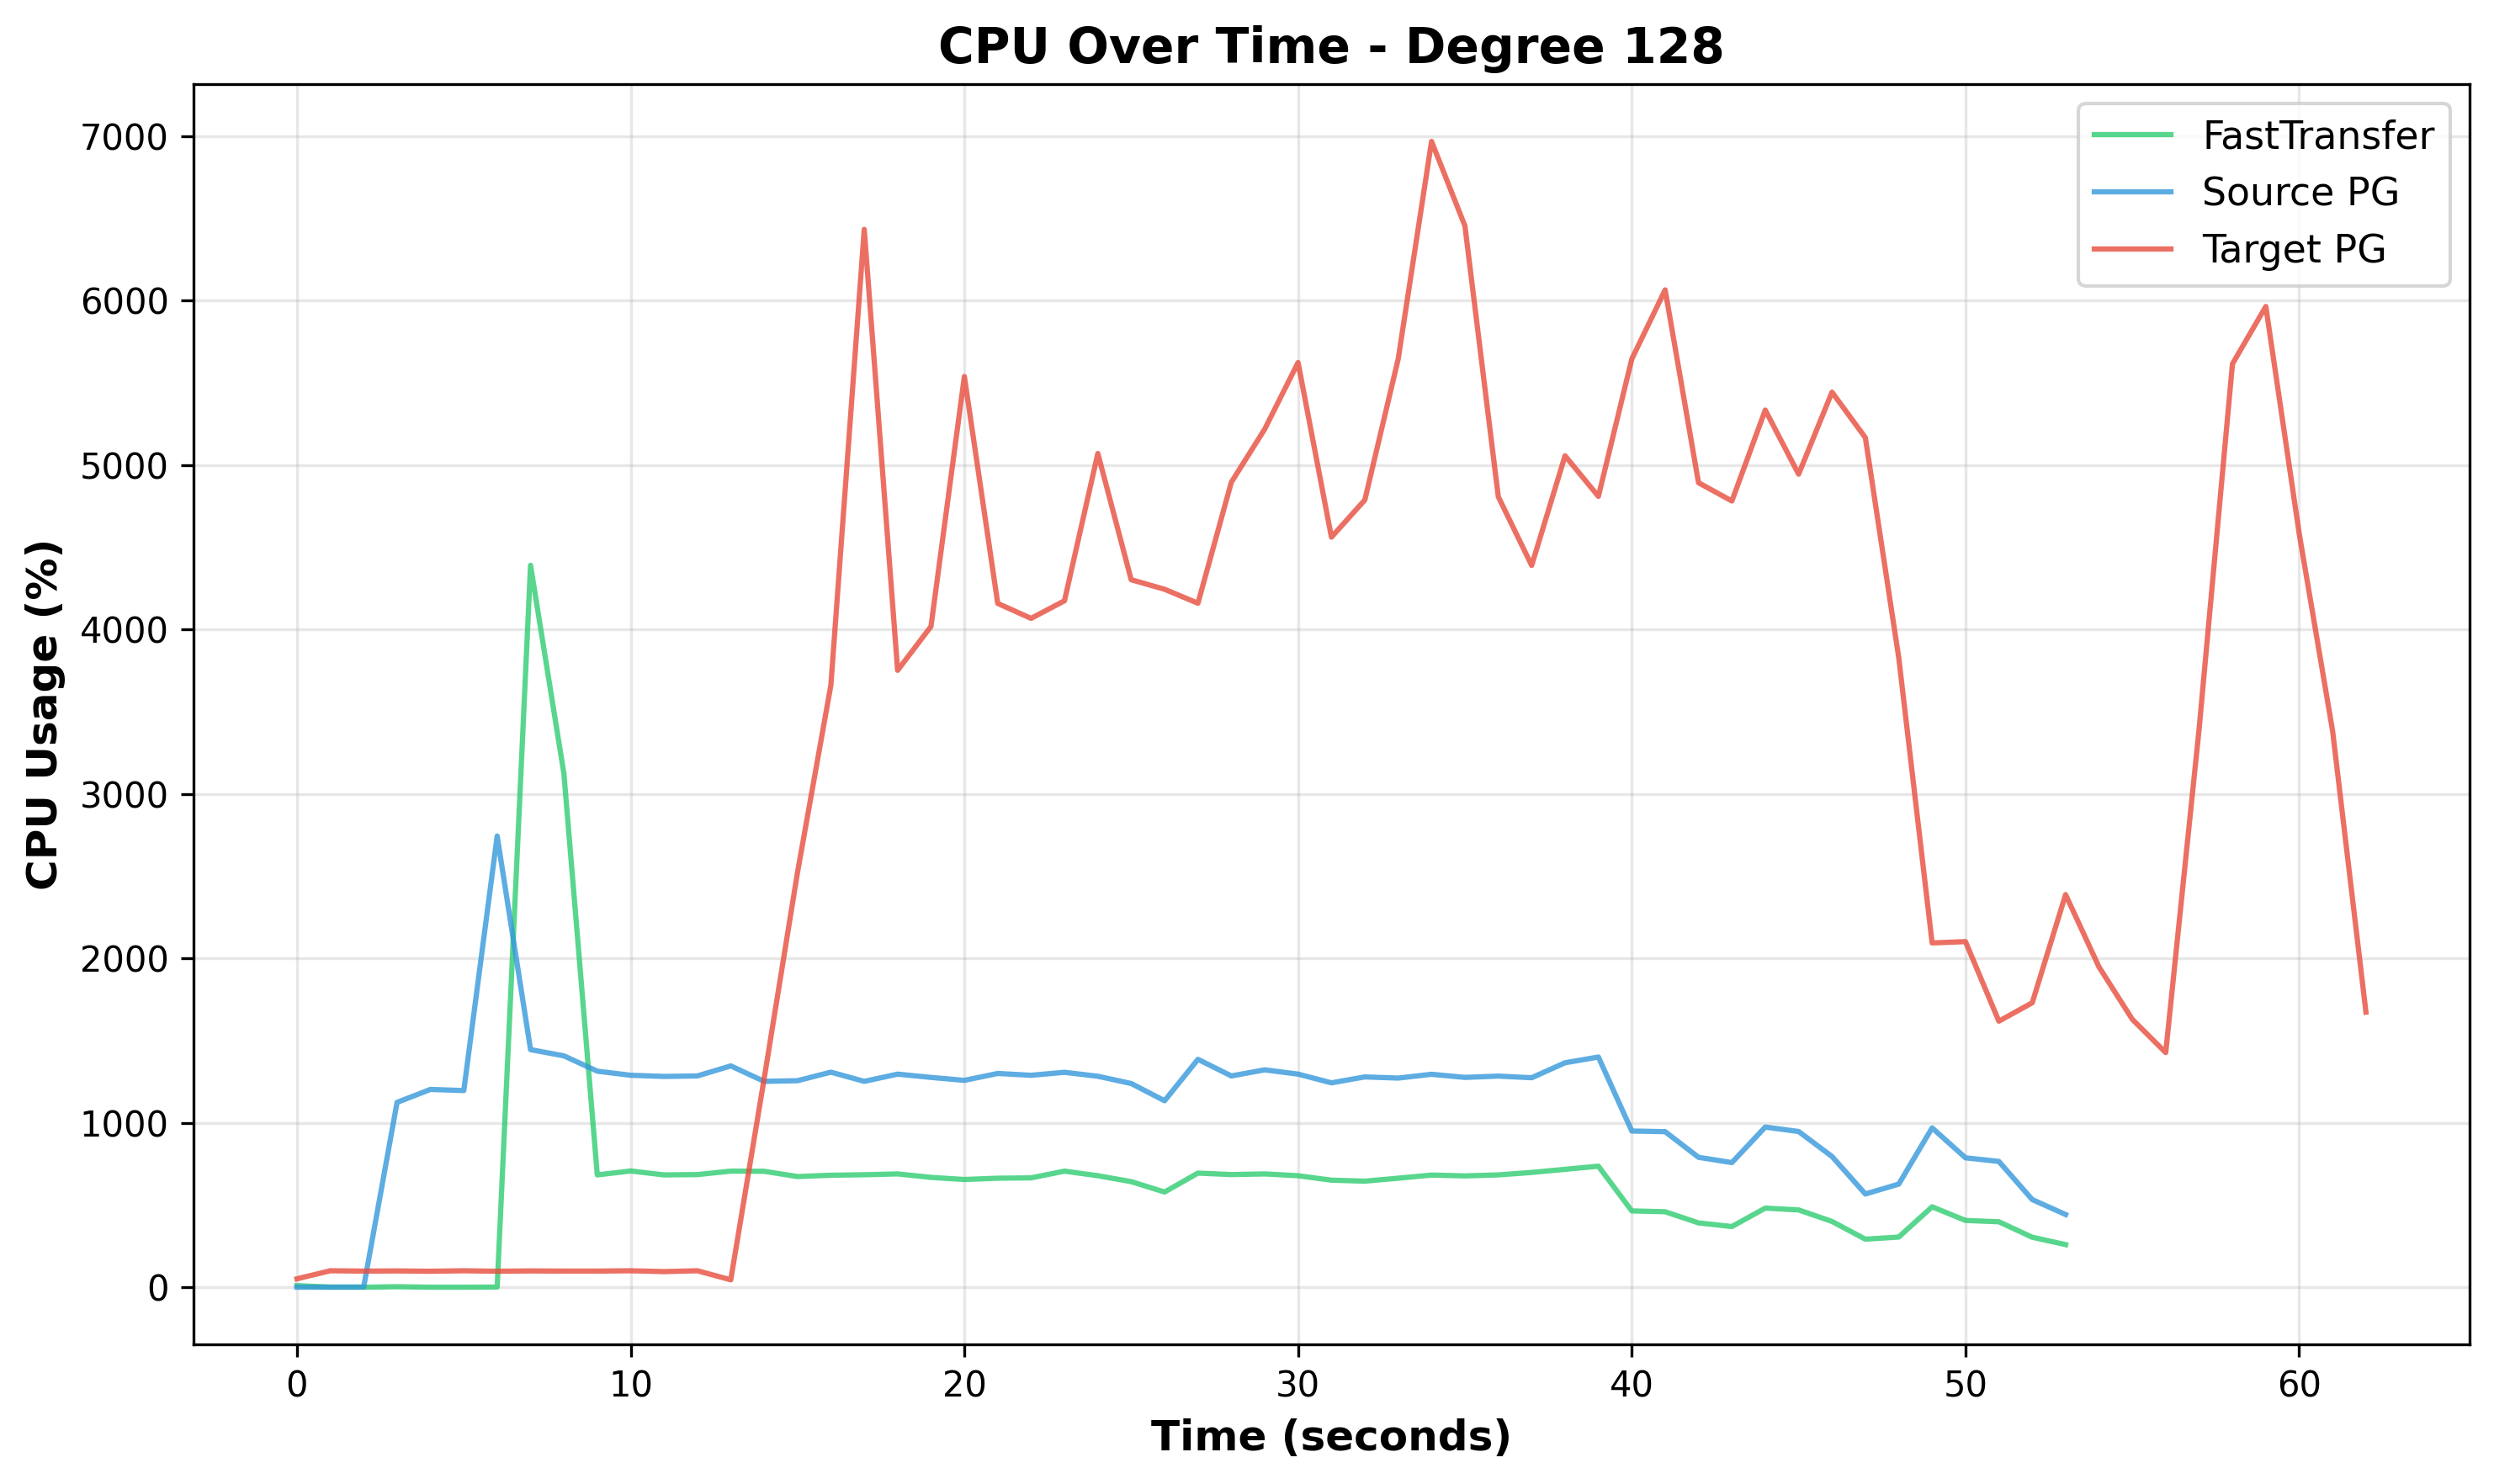
Figure 14: CPU Over Time at Degree 128 - Target PostgreSQL (red) exhibits oscillations with wild CPU swings, suggesting significant lock thrashing. Source (blue) and FastTransfer (green) show variability reflecting downstream backpressure.
4. Performance Scaling Analysis: Degrees 64 to 128
4.1 Continued Performance Improvement at Extreme Parallelism
Degree 128 achieves the best absolute performance in the test suite, completing the transfer in 67 seconds compared to 92 seconds at degree 64, a meaningful 1.37x speedup that brings total throughput to 1.69 GB/s. While this represents 68.7% efficiency for the doubling operation (rather than the theoretical 2x), the continued improvement demonstrates that the system remains functional and beneficial even at extreme parallelism levels.
Interestingly, mean CPU decreases 25.3% (4,410% → 3,294%) despite doubling parallelism, while peak CPU increases 21.7% (5,727% → 6,969%). This apparent paradox occurs because network saturation at degree 128 moderates lock contention intensity, allowing the system to maintain productivity despite the coordination challenges inherent in managing 128 parallel streams.
4.2 Network Bottleneck as Accidental Governor
A fascinating paradox: degree 128 exhibits lower system CPU overhead (63.0%) than degree 64 (83.2%) despite doubling parallelism. This occurs because network saturation acts as an accidental rate governor.
The Comparative Analysis:
| Transition | Elapsed Time | Speedup | System CPU | User CPU per Total |
|---|---|---|---|---|
| Degree 32 → 64 | 106s → 92s | 1.15x (57.5% efficiency) | 83.2% at degree 64 | 16.8% productive work |
| Degree 64 → 128 | 92s → 67s | 1.37x (68.7% efficiency) | 63.0% at degree 128 | 37.0% productive work |
The Governor Effect:
At degree 64 (no network limitation): All 64 streams simultaneously bombard the target, creating massive lock queue buildup. System CPU reaches 83.2% as processes spin on locks.
At degree 128 (network-limited): Network throughput plateaus at ~2,450 MB/s during active bursts (98% of 2.5 GB/s capacity). Data delivery is paced by network capacity, moderating lock contention intensity. Processes spend more time in I/O wait rather than lock spinning. System CPU drops to 63.0% with nearly double the user CPU (1,219% vs 741%).
Critical Caveat: This doesn’t mean network bottlenecks are desirable. Network saturation occurs only at degree 128 and doesn’t explain poor scaling from degree 1-64. The primary bottleneck causing poor scaling efficiency (13.1x instead of 128x) remains target CPU lock contention across the entire tested range.
5. Disk I/O and Network Analysis
5.1 FIO Disk Benchmarks vs PostgreSQL Performance
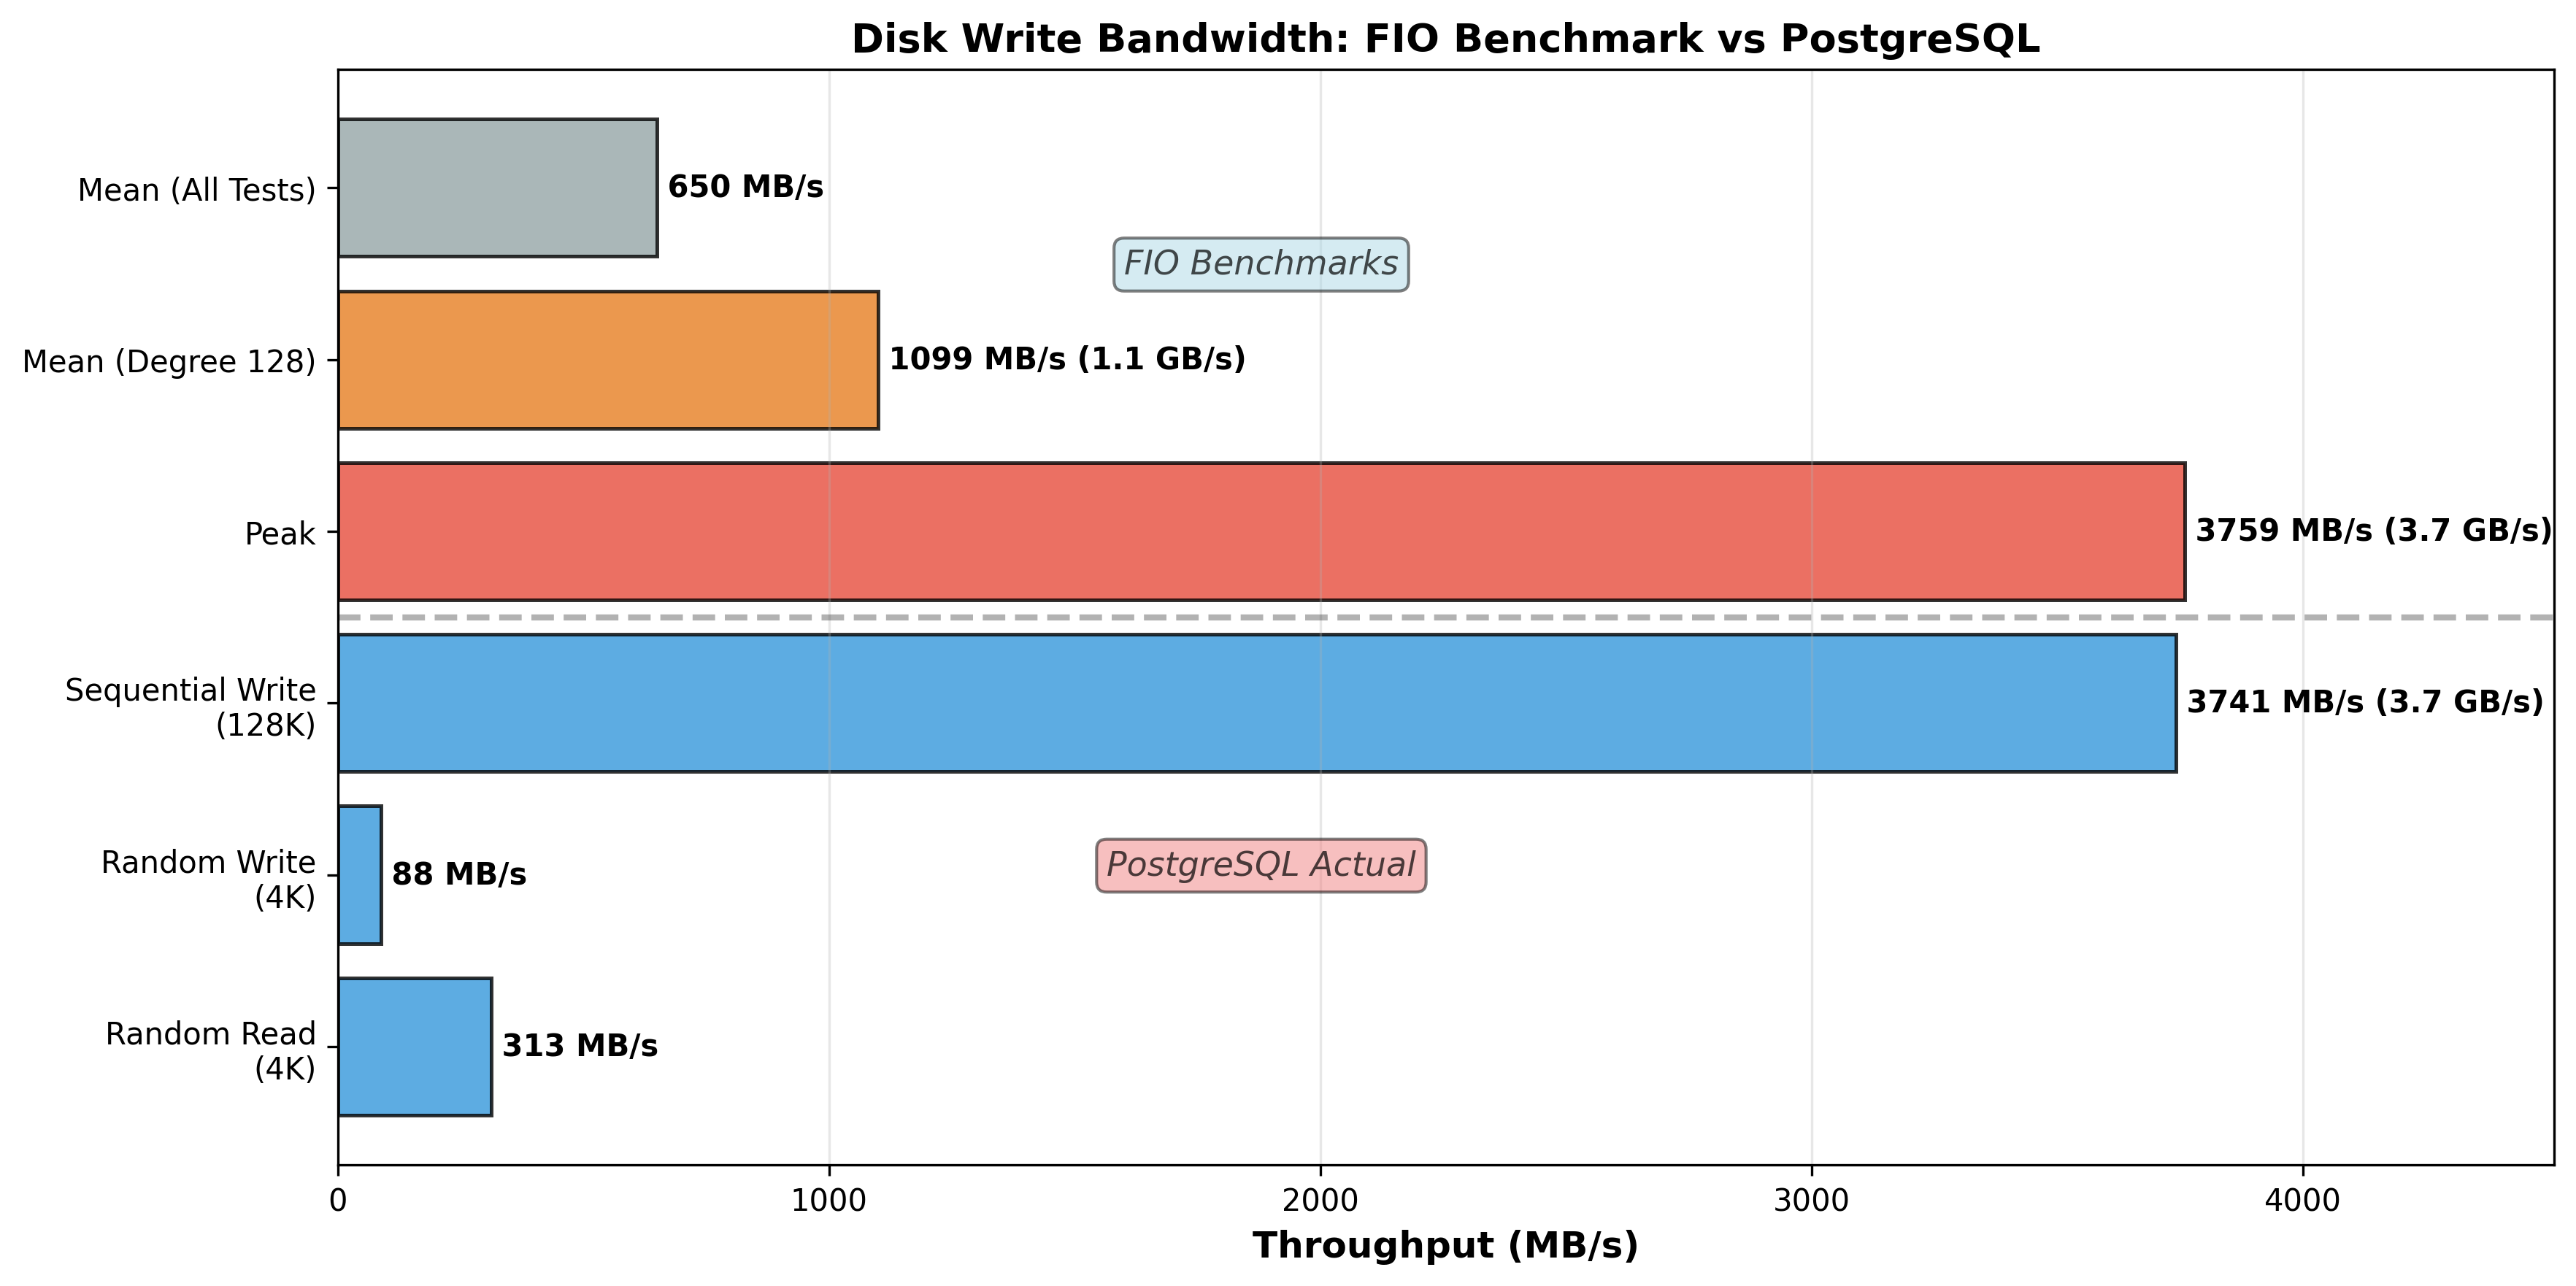
Figure 15a: FIO Benchmark vs PostgreSQL Actual Performance (Bandwidth) - PostgreSQL achieves 3,759 MB/s peak (100.5% of FIO’s 3,741 MB/s), demonstrating it can saturate disk during bursts. However, average is only 170 MB/s (4.5% of peak), revealing highly bursty behavior with long idle periods.
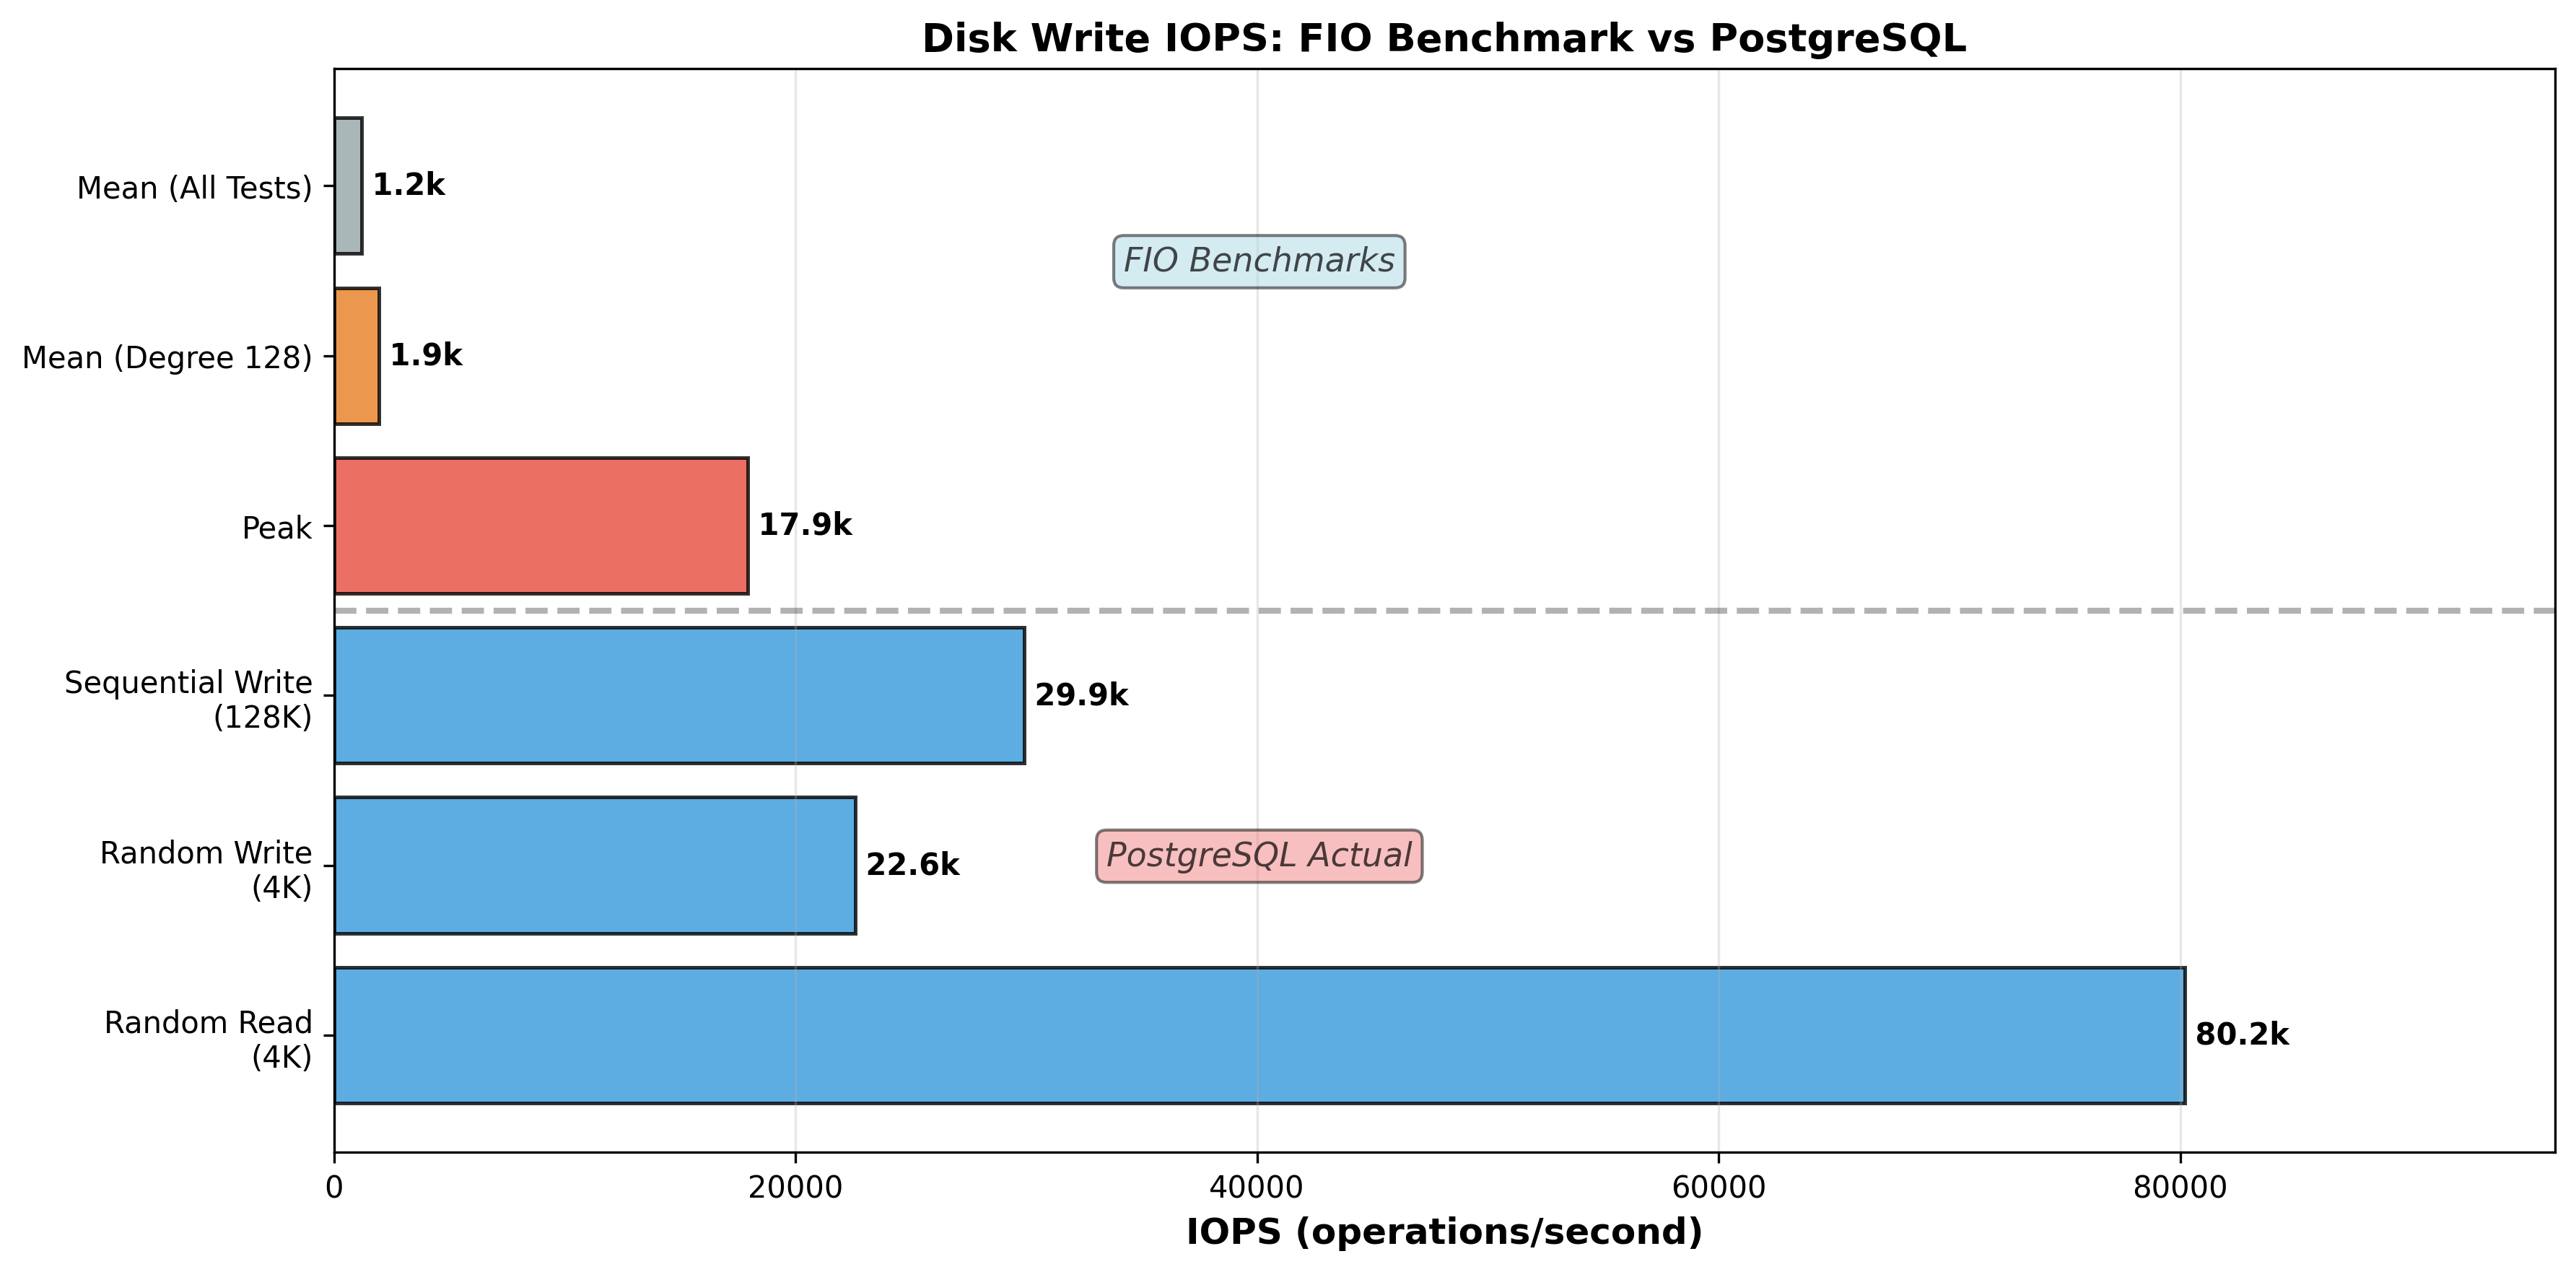
Figure 15b: FIO Benchmark vs PostgreSQL Actual Performance (IOPS) - Peak IOPS reaches 55,501 operations per second during intensive bursts, but average IOPS is only 207 operations per second, further confirming the bursty pattern with most time spent idle or at low activity levels.
FIO Results:
- Sequential Write (128K): 3,741 MB/s, 29,900 IOPS
- Random Read (4K): 313 MB/s, 80,200 IOPS
- Random Write (4K): 88.2 MB/s, 22,600 IOPS
PostgreSQL Actual:
- Peak Write: 3,759 MB/s, 55,501 IOPS (matches FIO sequential)
- Mean Write: 170 MB/s, 207 IOPS (only 4.5% of peak)
- Mean Disk Utilization: 14.6% (disk idle 85% of the time)
5.2 Target Disk I/O Time Series
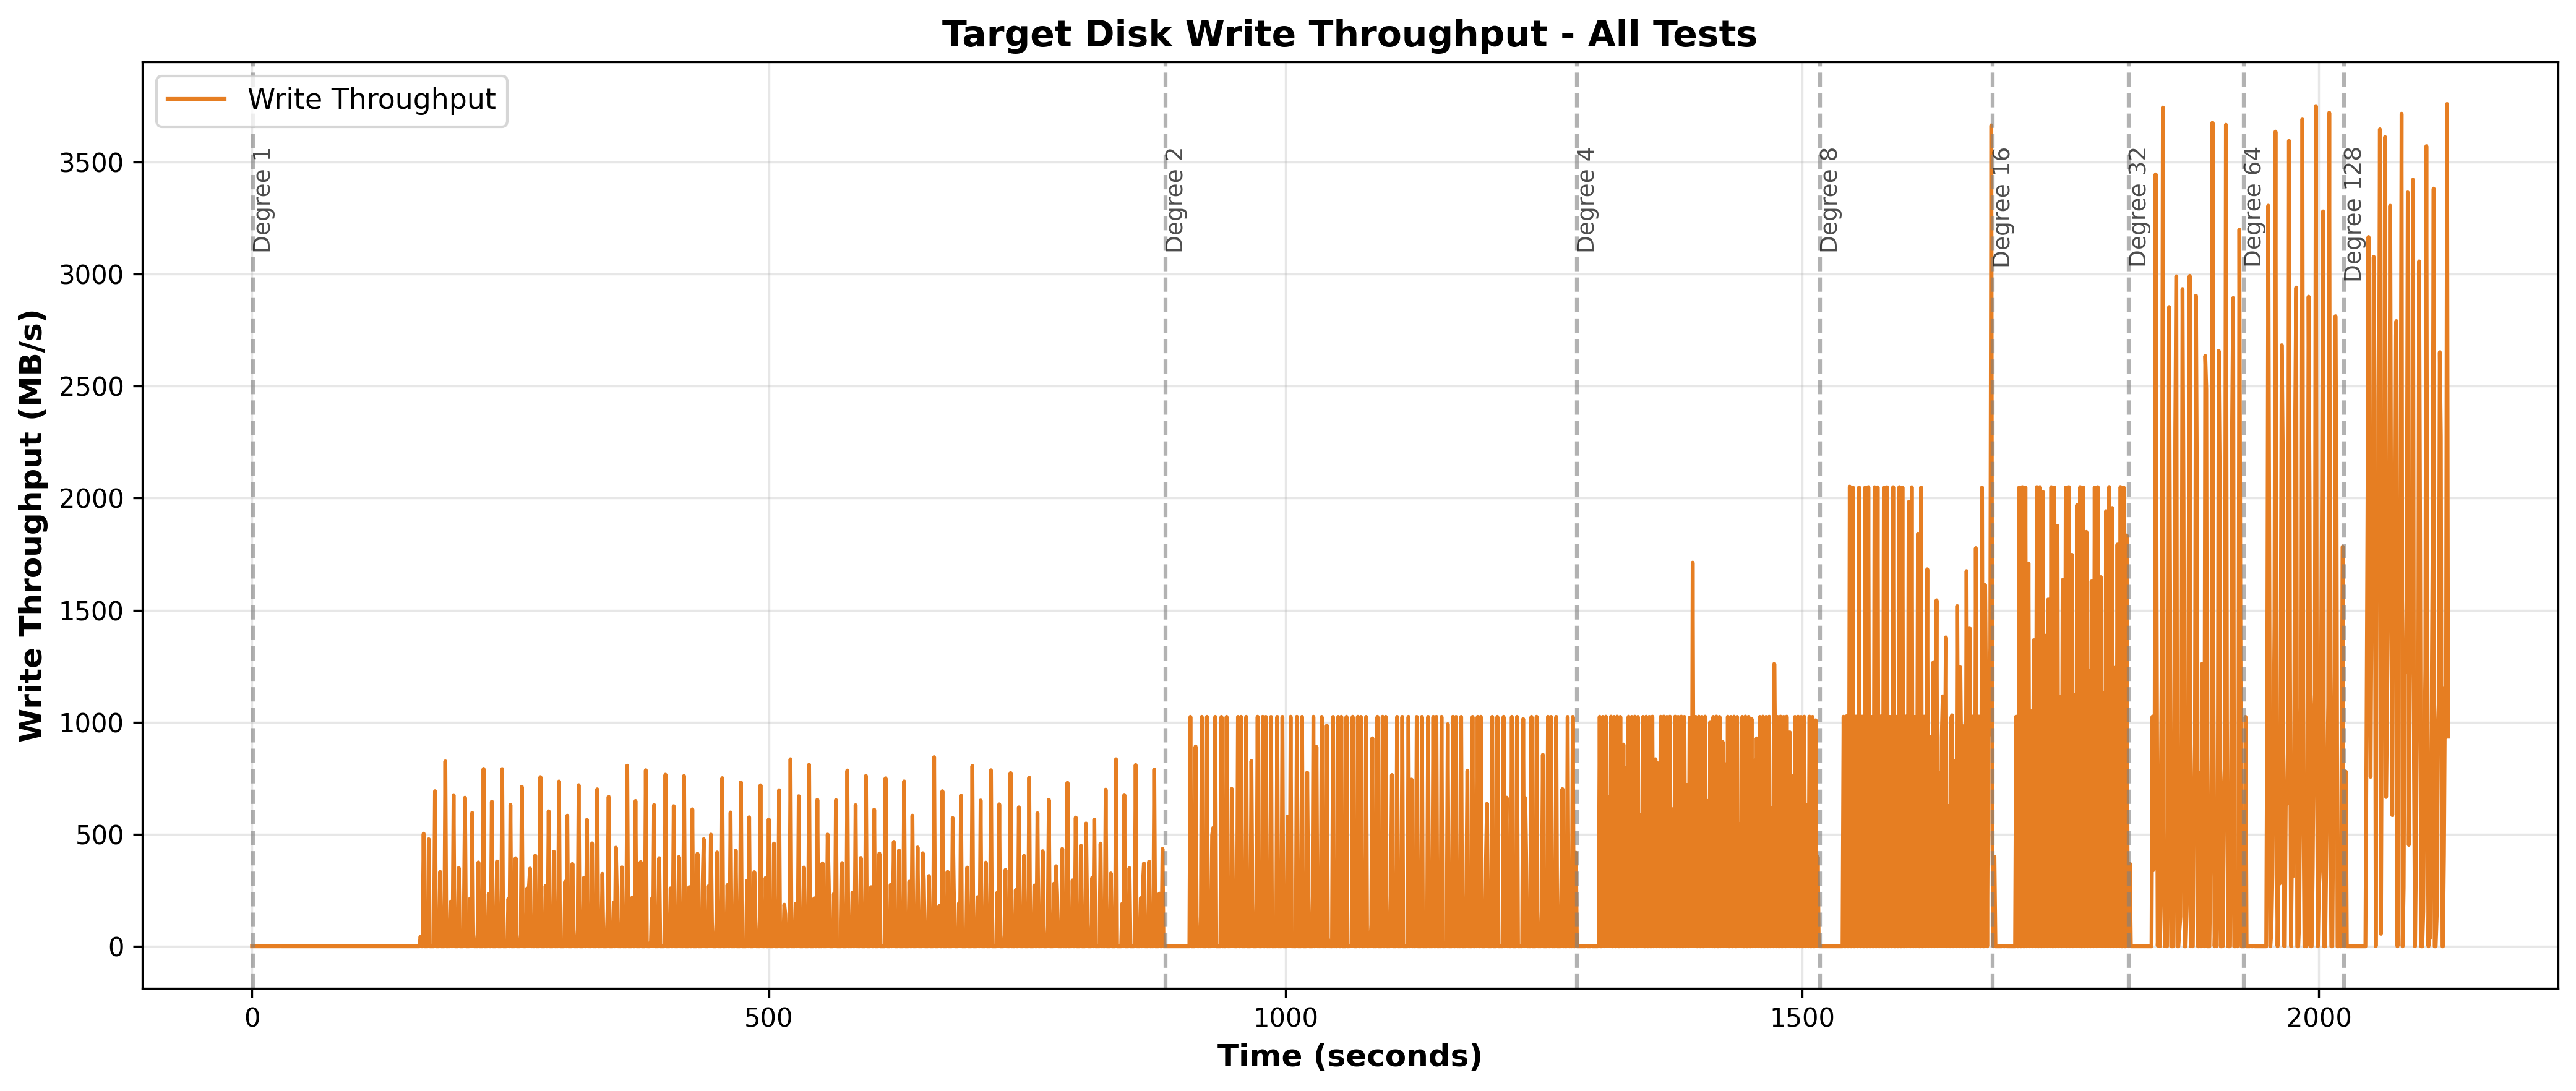
Figure 16: Target Disk Write Throughput Over Time - Vertical lines mark test boundaries (degrees 1, 2, 4, 8, 16, 32, 64, 128). Throughput exhibits bursty behavior with spikes to 2000-3759 MB/s followed by drops to near zero. Sustained baseline varies from ~100 MB/s (low degrees) to ~300 MB/s (degree 128) but never sustains disk capacity.
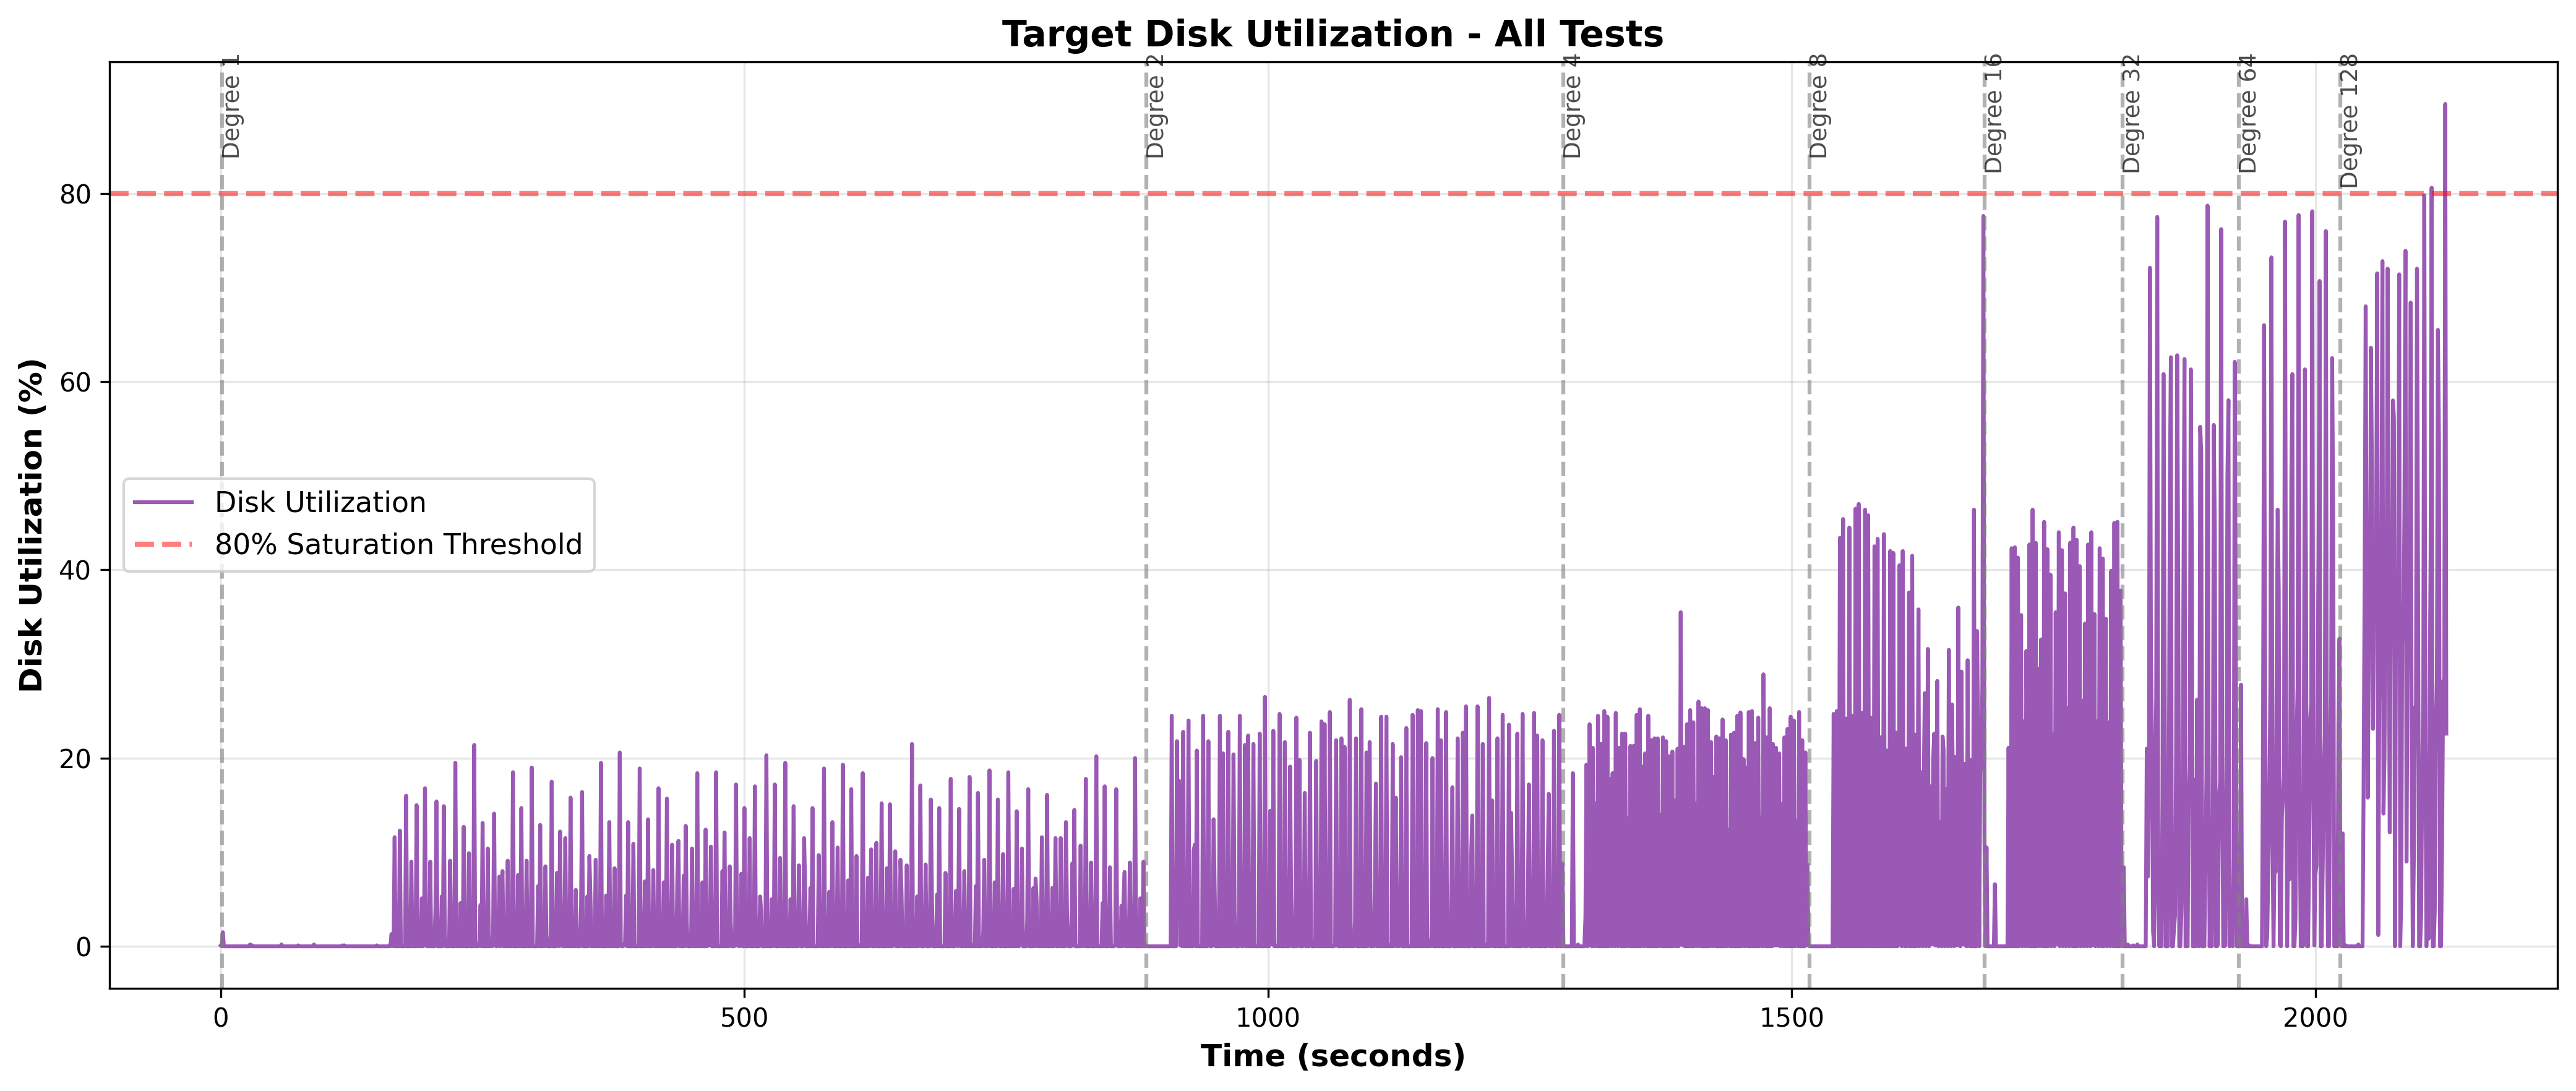
Figure 17: Target Disk Utilization Over Time - Mean utilization remains below 25% across all degrees. Spikes reach 70-90% during bursts but quickly return to low baseline. This strongly suggests disk I/O is not the bottleneck.
5.3 Network Throughput Analysis
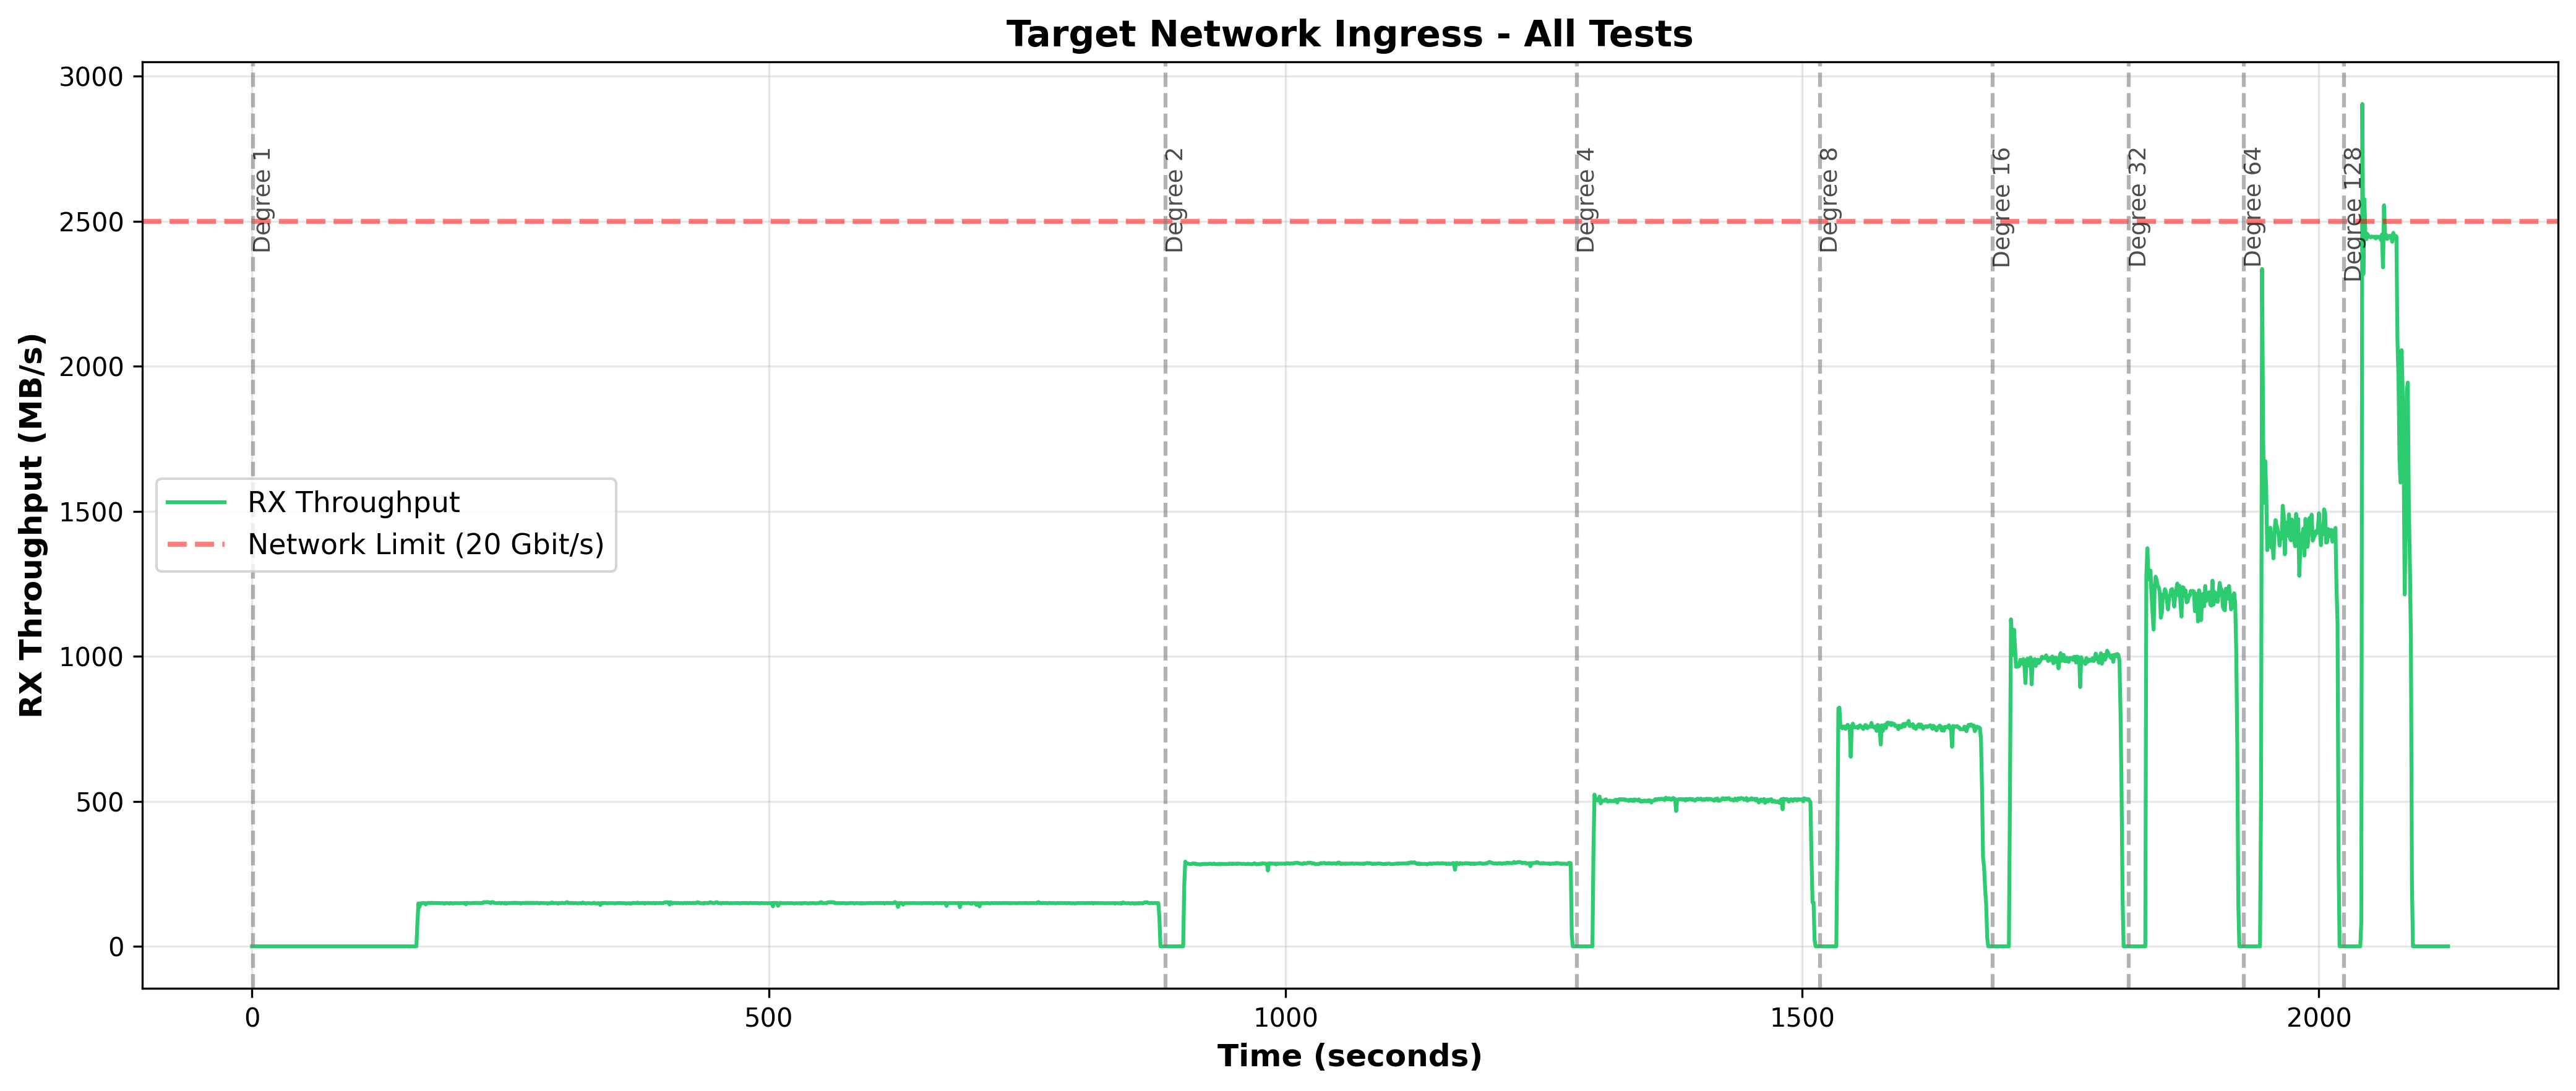
Figure 18: Target Network Ingress Over Time - At degree 128, throughput plateaus at ~2,450 MB/s (98% of capacity) during active bursts, but averages only 1,088 MB/s (43.5%) due to alternating active/idle periods. At degrees 1-64, network remains well below capacity.
Network Scaling Summary:
| Degree | Mean RX | % of 2.5 GB/s Capacity | Active Burst Plateau |
|---|---|---|---|
| 1 | 122 MB/s | 4.9% | Well below capacity |
| 8 | 631 MB/s | 25.3% | Well below capacity |
| 16 | 769 MB/s | 30.8% | Well below capacity |
| 32 | 911 MB/s | 36.4% | Well below capacity |
| 64 | 1,033 MB/s | 41.3% | Well below capacity |
| 128 | 1,088 MB/s | 43.5% | ~2,450 MB/s (98%) during bursts |
Network saturation occurs only at degree 128 during active bursts. Therefore, network doesn’t explain poor scaling from degree 1 through 64, target CPU lock contention remains the primary bottleneck.
5.4 Cross-Degree Scaling Analysis
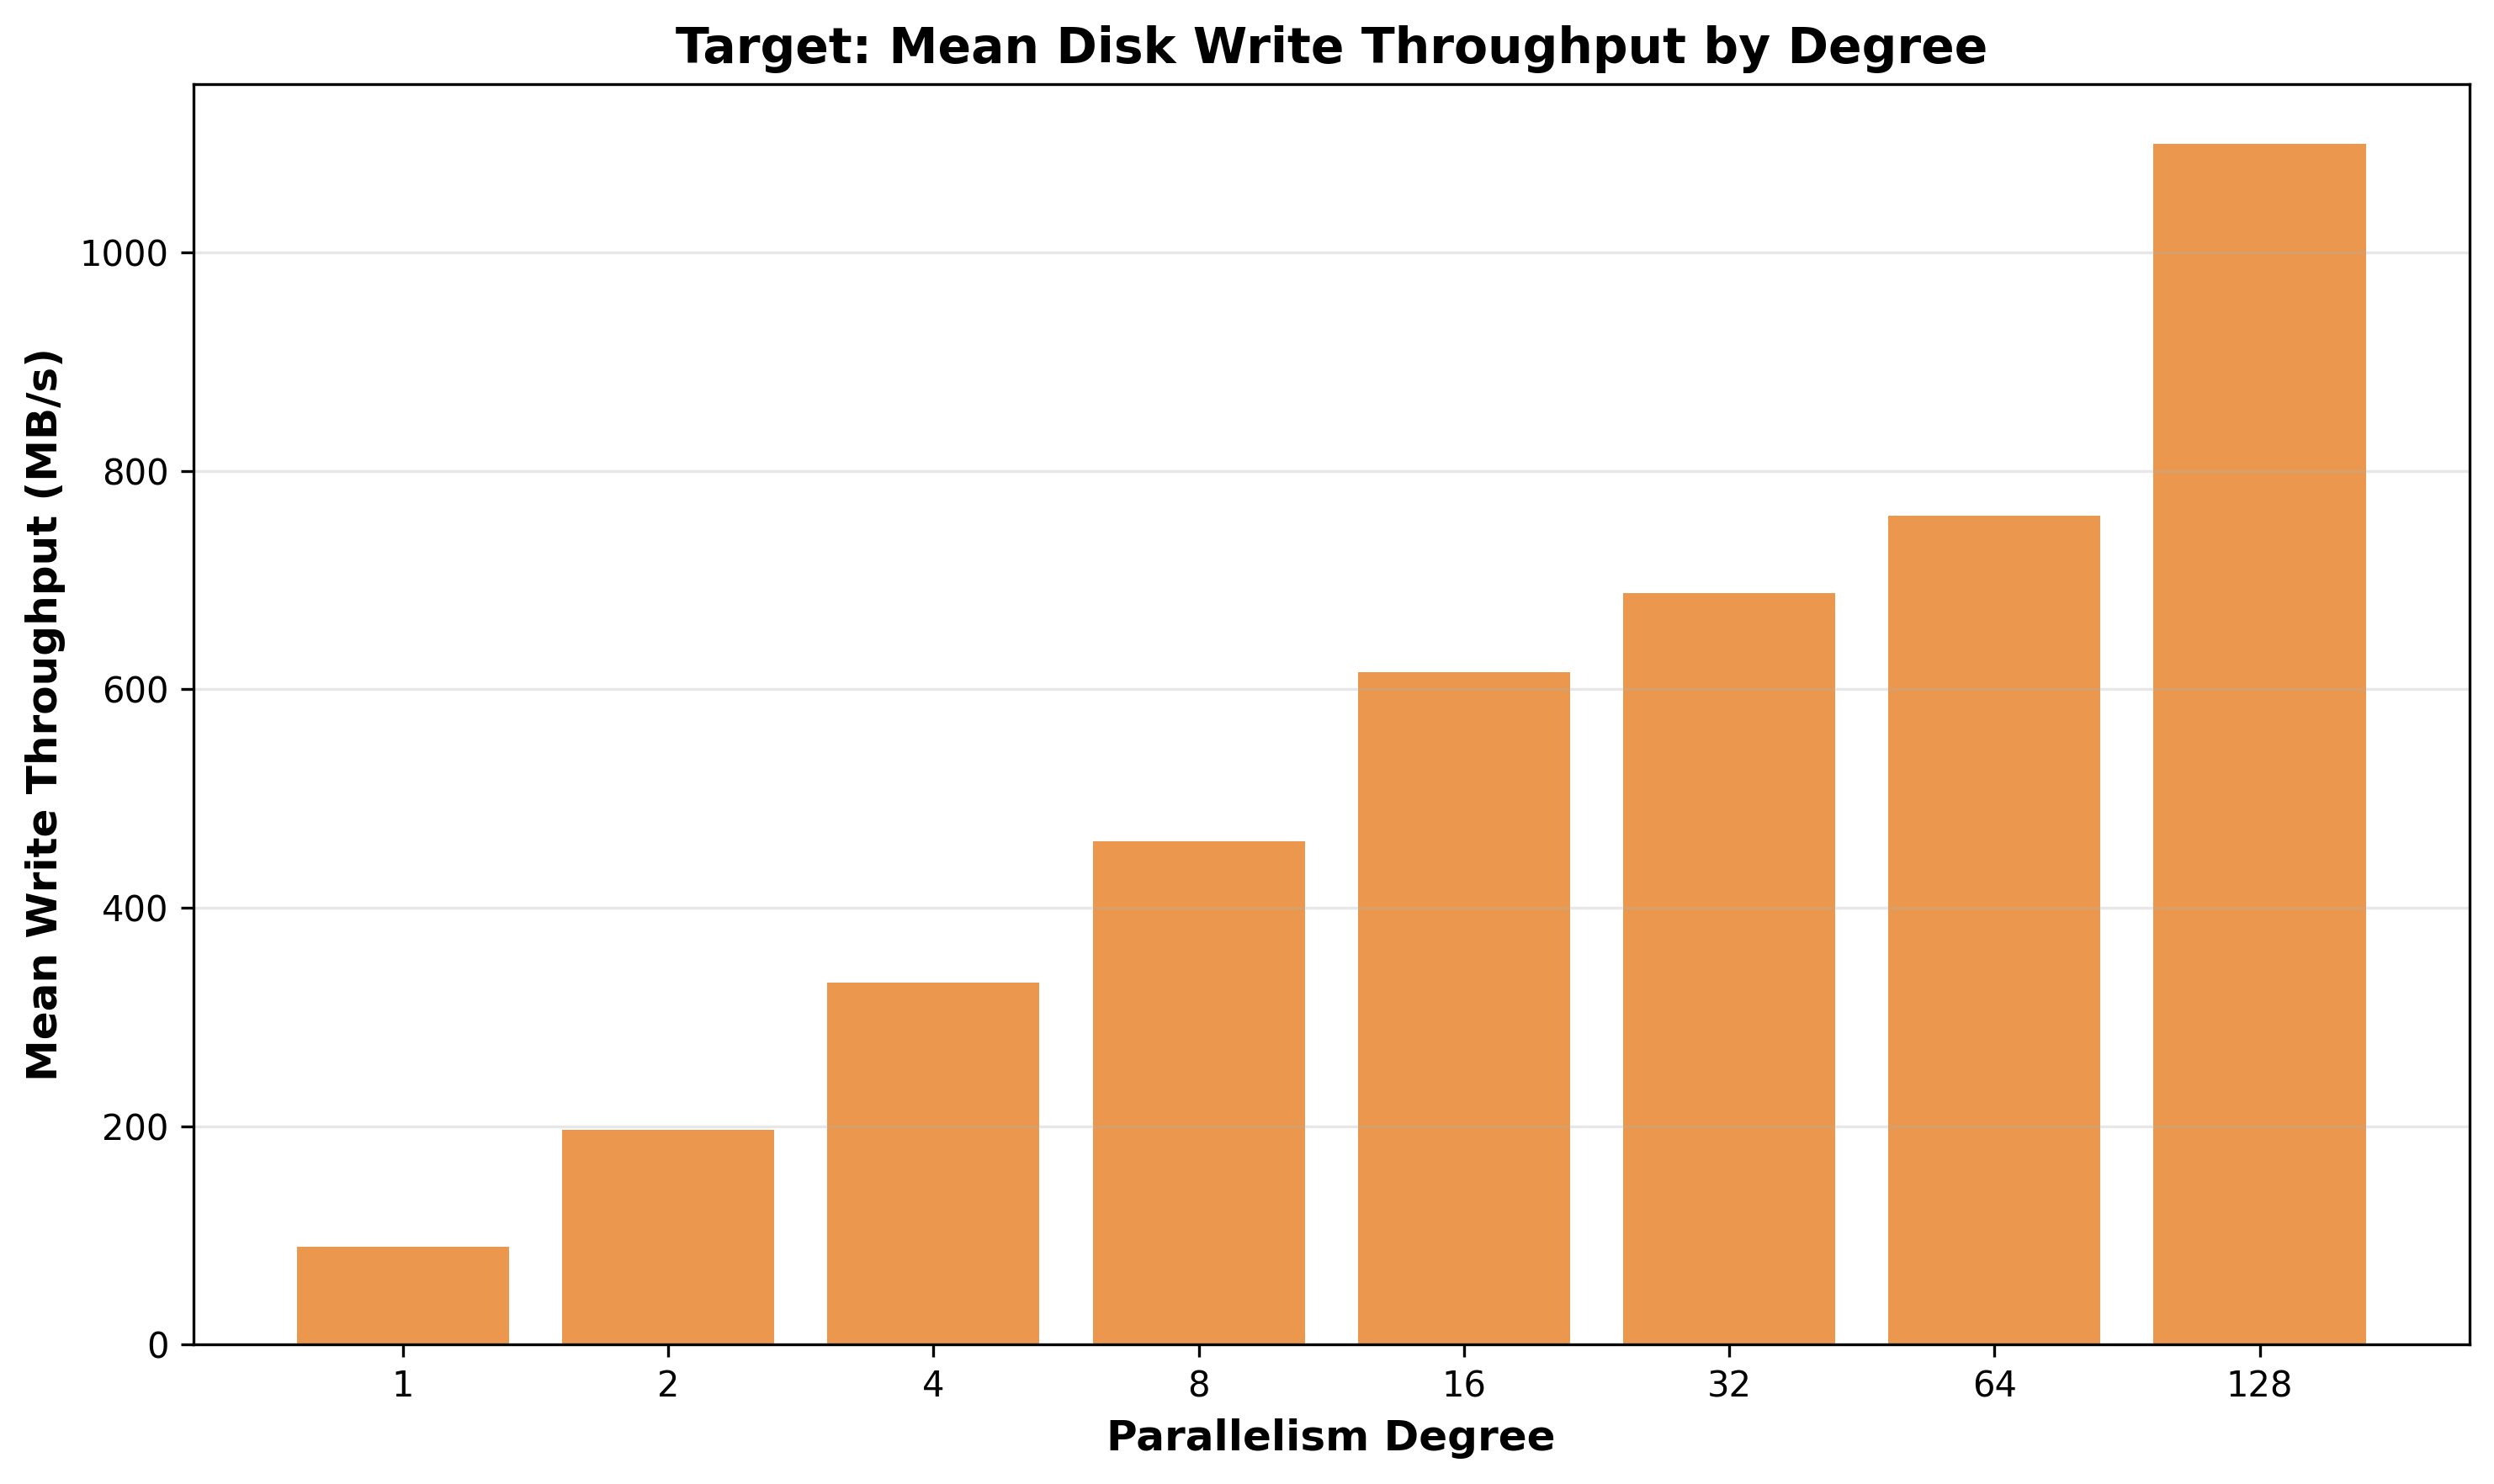
Figure 19: Mean Disk Write Throughput by Degree - Scales from 90 MB/s (degree 1) to 1,099 MB/s (degree 128), only 12.3x improvement for 128x parallelism (9.6% efficiency).
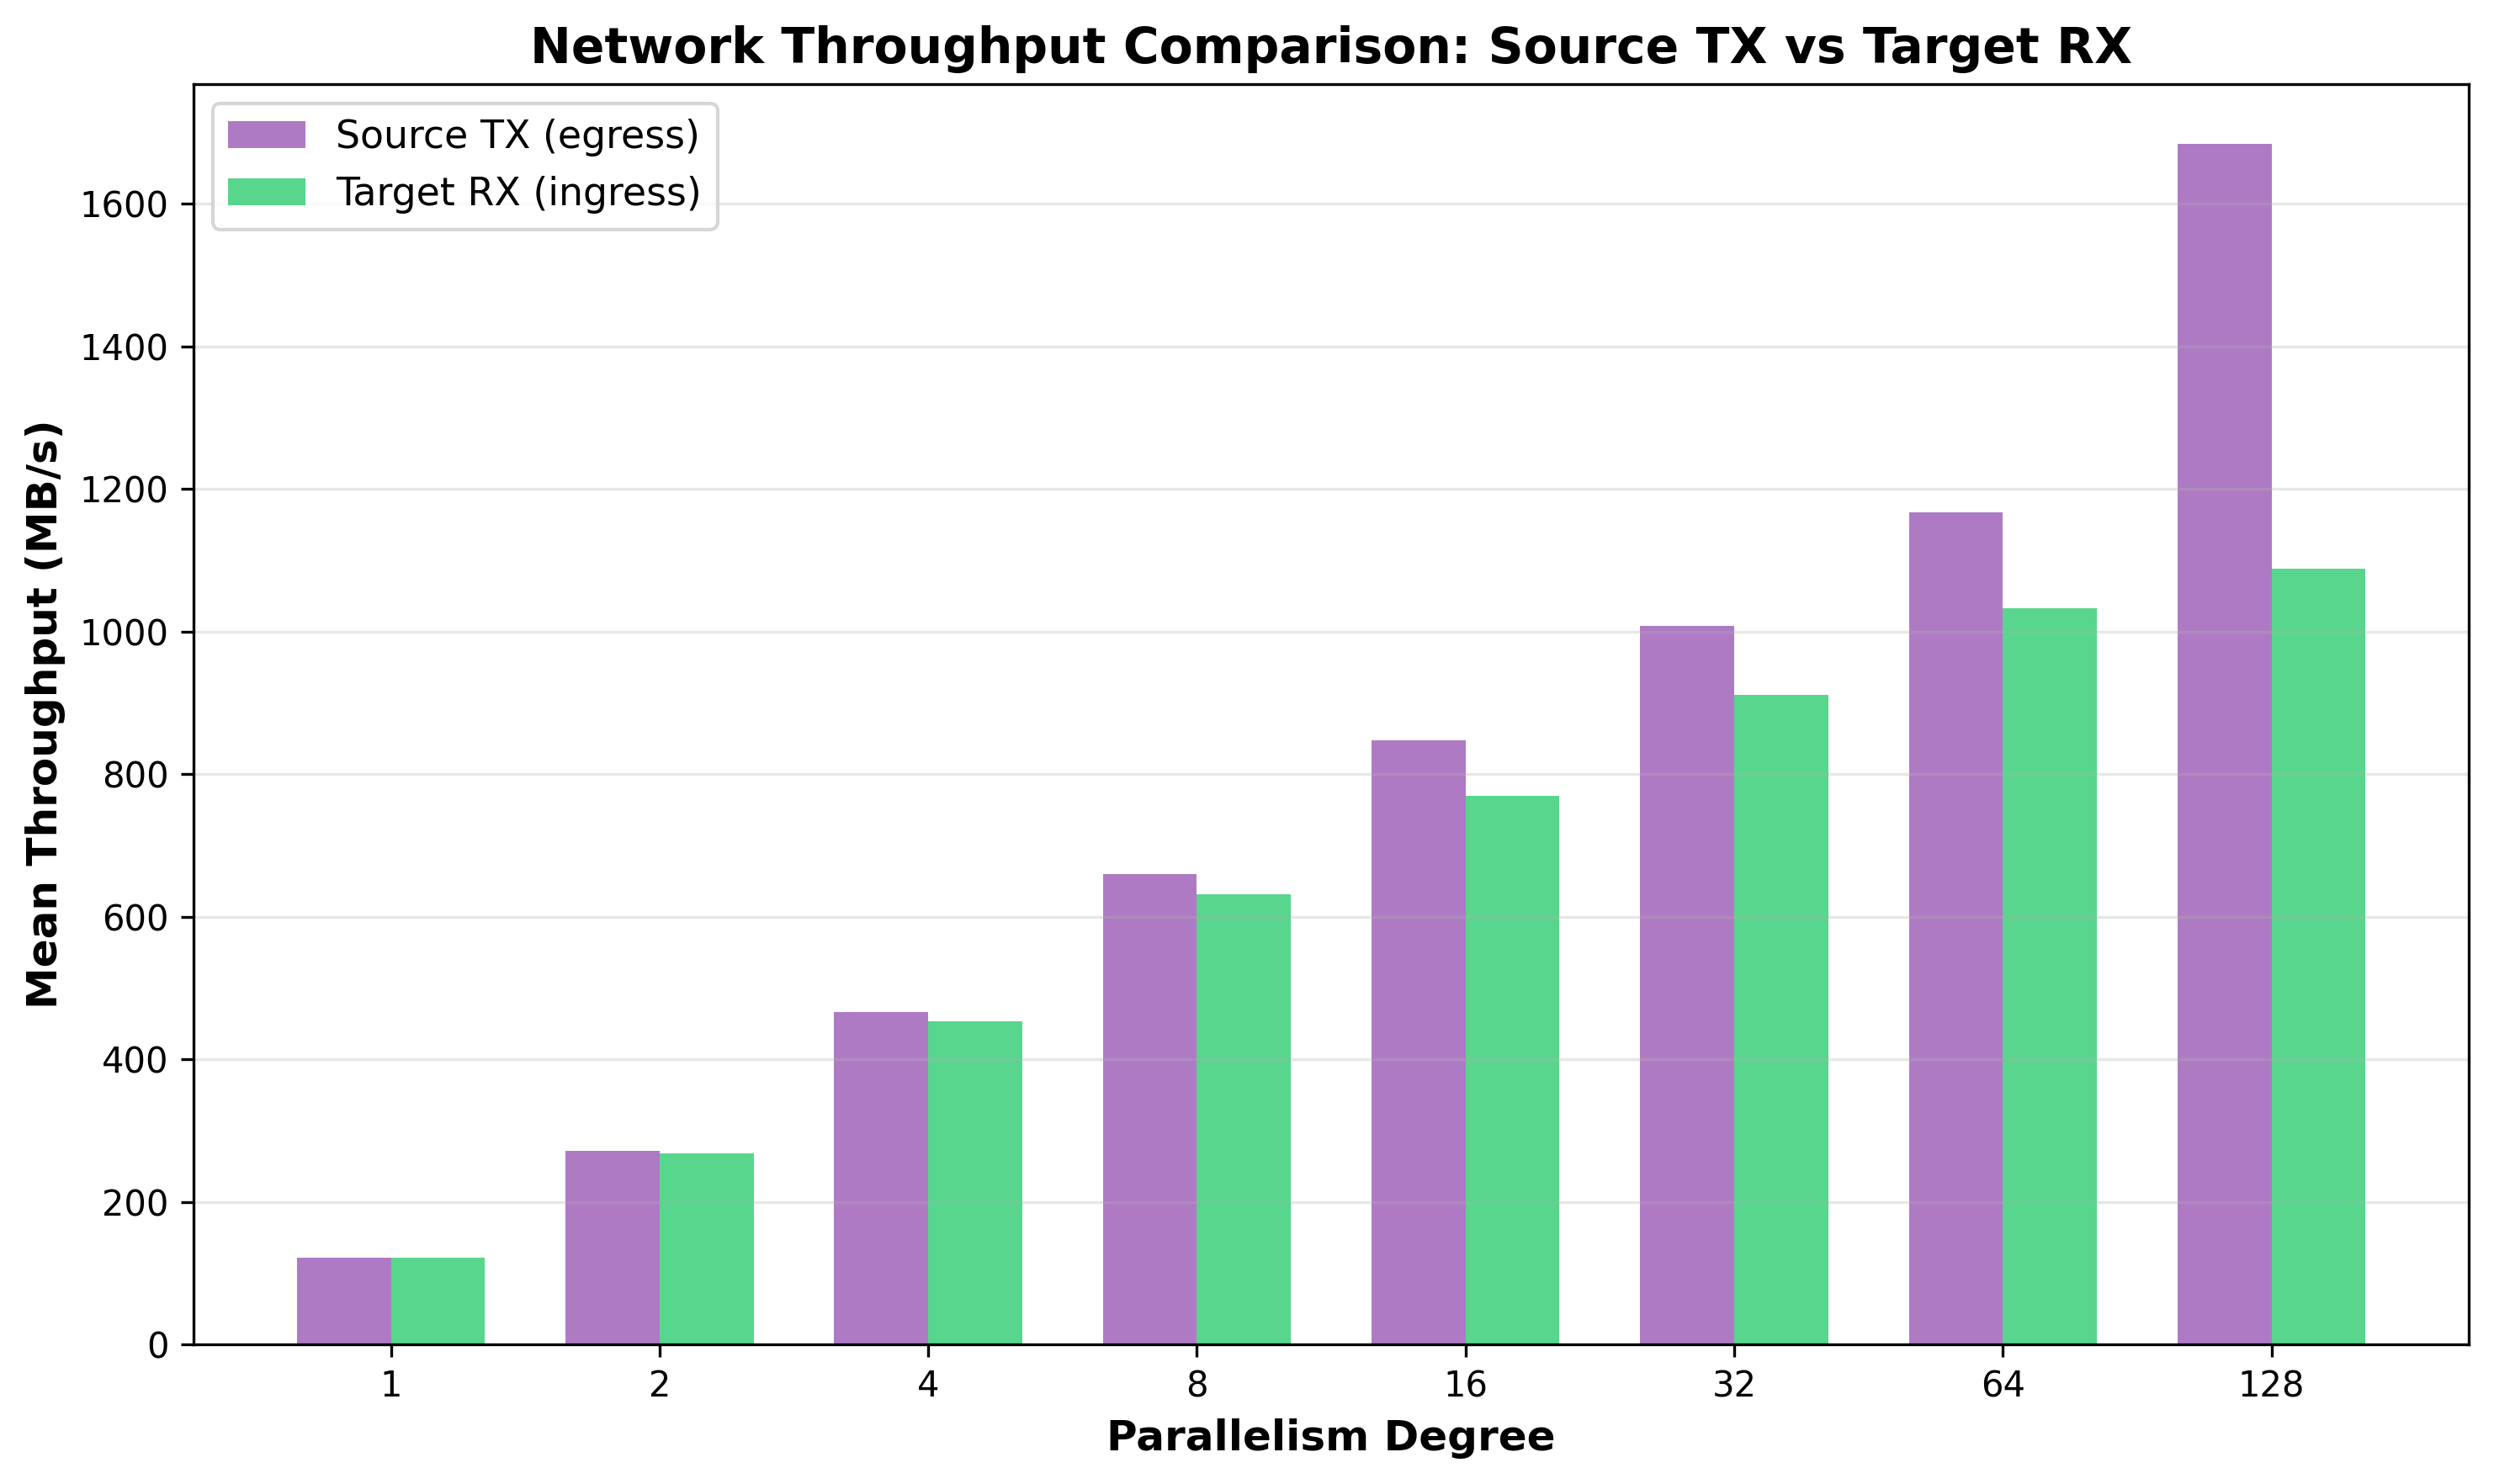
Figure 20: Network Throughput Comparison: Source TX vs Target RX - At degree 128, source transmits 1,684 MB/s while target receives only 1,088 MB/s, creating a 596 MB/s (35%) deficit. This suggests the target cannot keep pace with source data production, likely due to CPU lock contention.
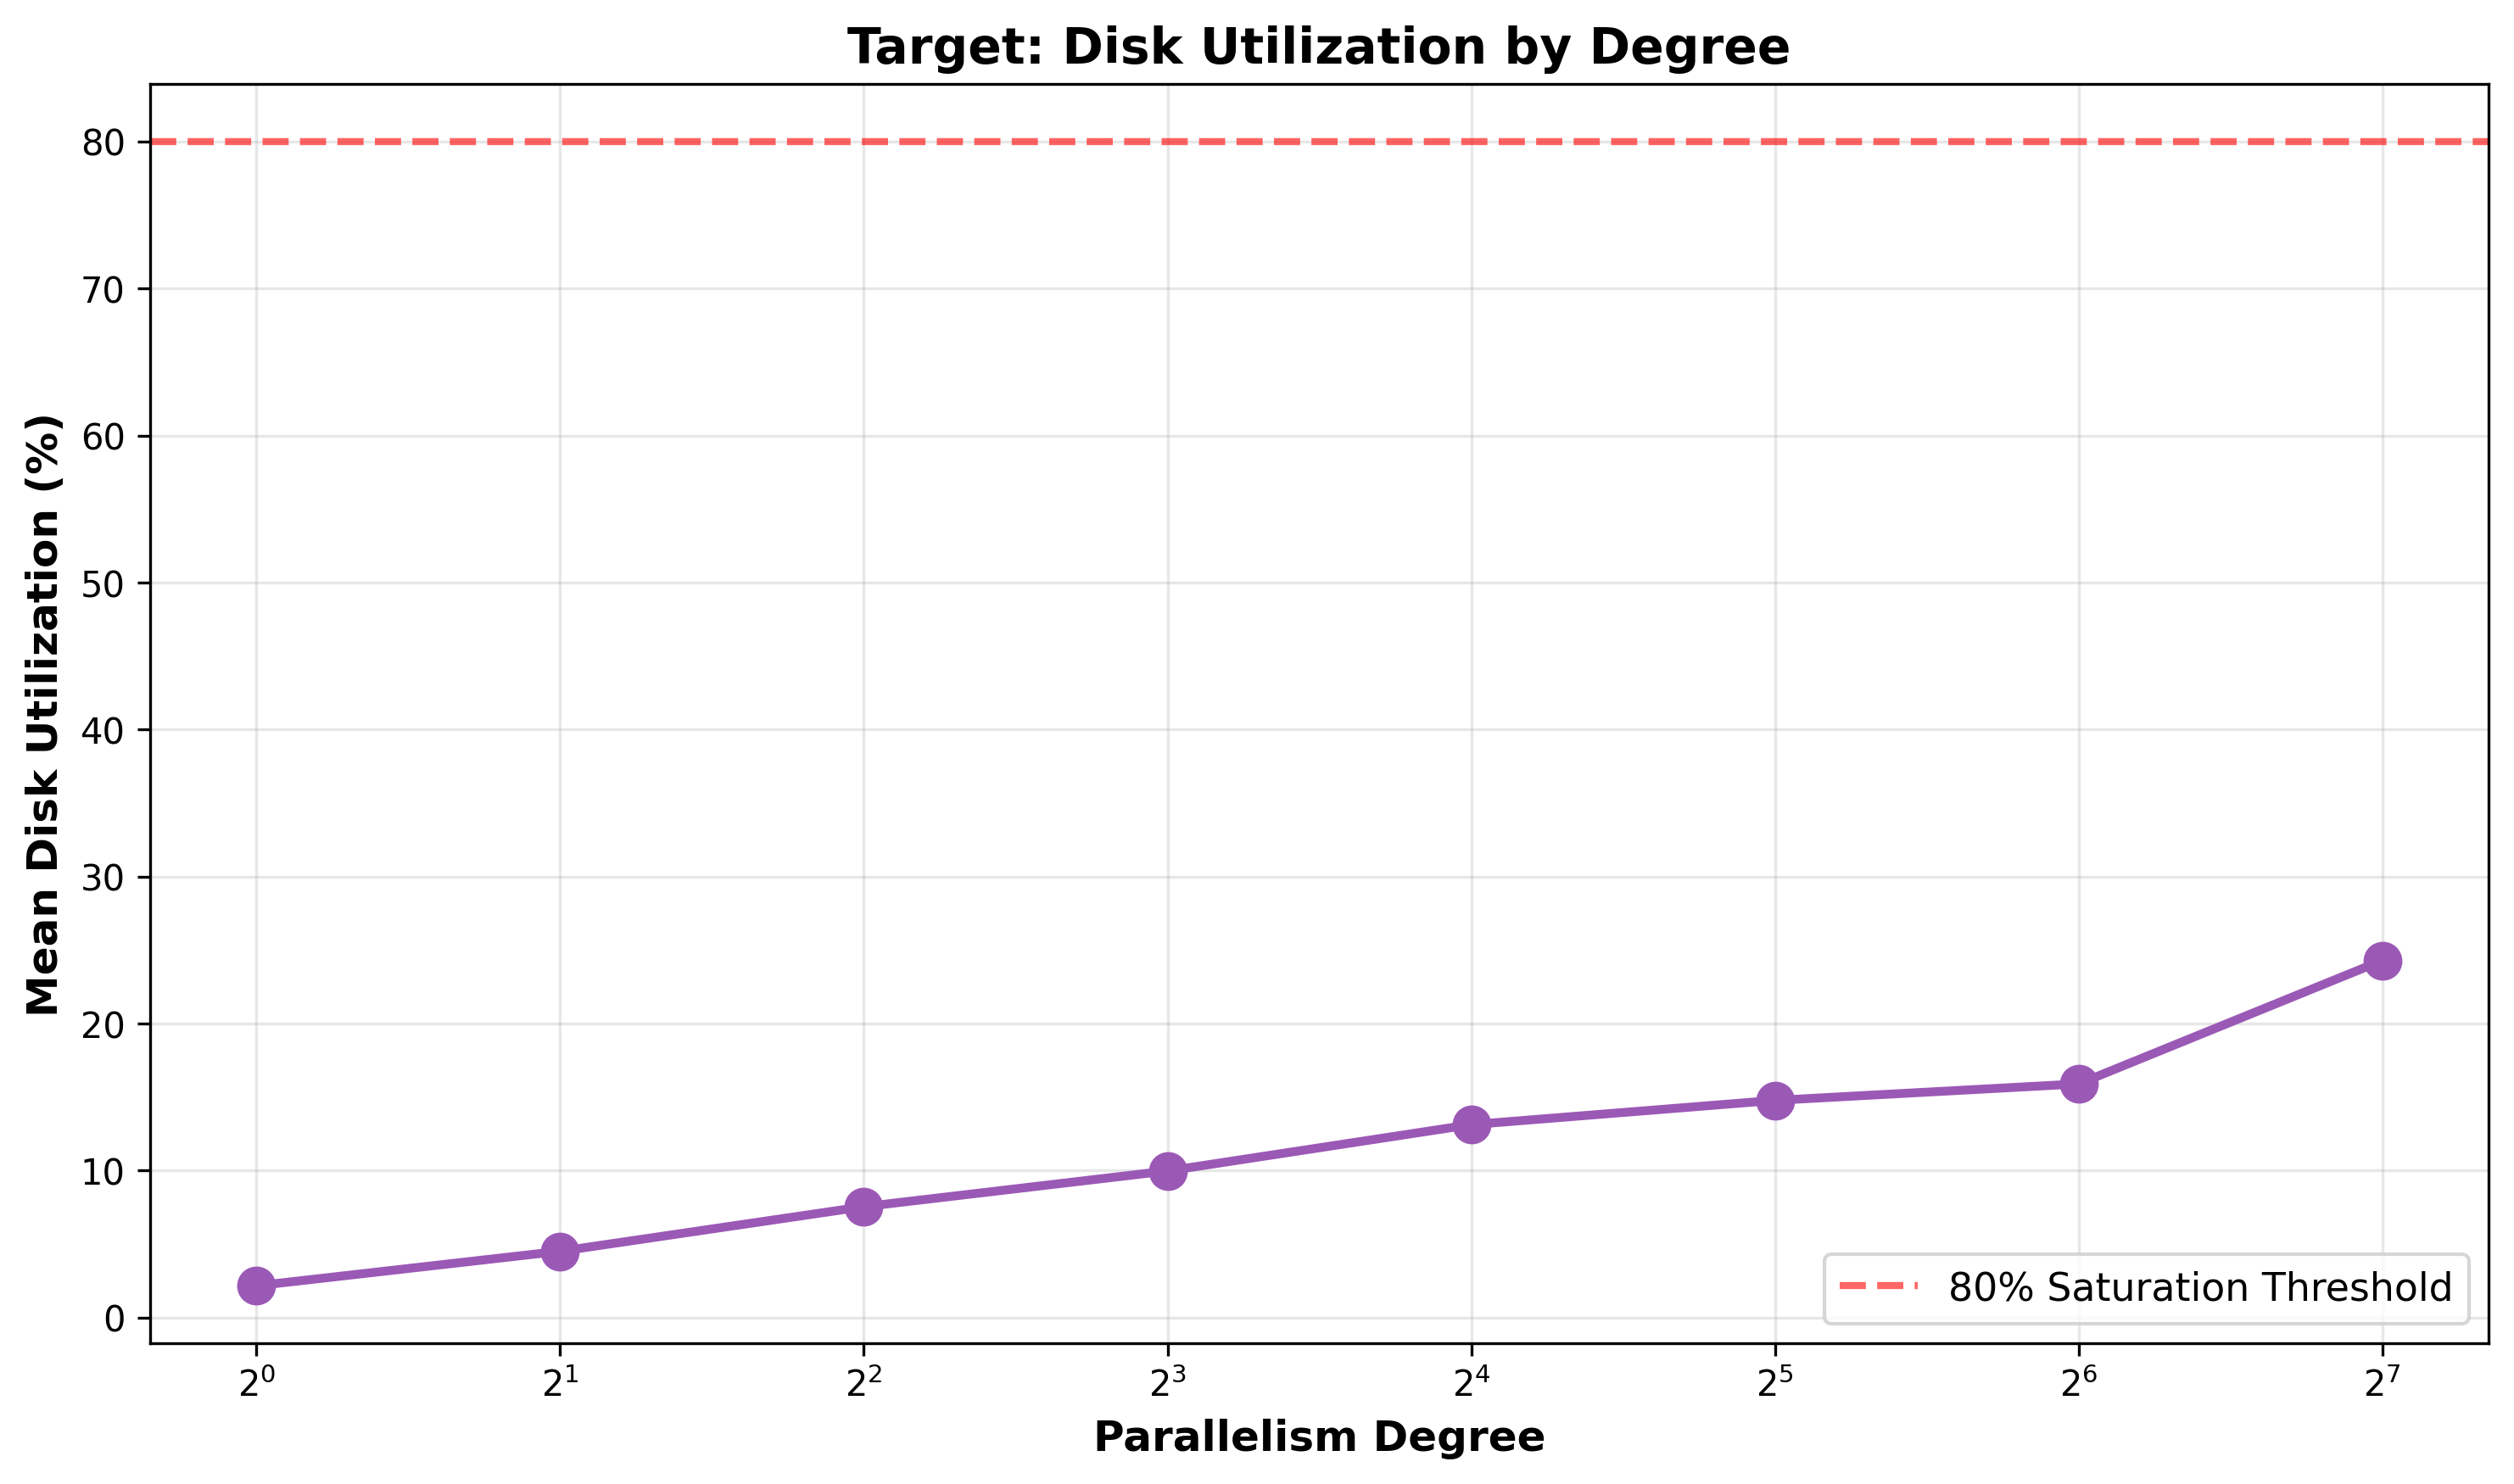
Figure 21: Disk Utilization by Degree - Mean utilization increases from 2.2% (degree 1) to only 24.3% (degree 128), remaining far below the 80% saturation threshold at all degrees. This strongly indicates disk I/O is not the bottleneck.
5.5 I/O Analysis Conclusions
-
Disk does not appear to be the bottleneck: 24% average utilization at degree 128 with 76% idle capacity. PostgreSQL matches FIO peak (3,759 MB/s) but sustains only 170 MB/s average.
-
Network does not appear to be the bottleneck for degrees 1-64: Utilization remains below 42% through degree 64. Saturation occurs only at degree 128 during active bursts (~2,450 MB/s plateau).
-
Target CPU lock contention appears to be the root cause: Low disk utilization + network saturation only at degree 128 + poor scaling efficiency throughout + high system CPU percentage (83.2% at degree 64) all point to the same conclusion.
-
Backpressure suggests target bottleneck: Source can produce 1,684 MB/s but target can only consume 1,088 MB/s. Source processes use only 0.11 cores/process, suggesting they’re blocked waiting for target acknowledgments.
6. Conclusions
6.1 Performance Achievement and Bottleneck Analysis
FastTransfer successfully demonstrates strong absolute performance, achieving a 13.1x speedup that reduces 113GB transfer time from approximately 15 minutes (878s) to just over 1 minute (67s). This represents practical, production-ready performance with sustained throughput of 1.69 GB/s at degree 128. The system delivers continuous performance improvements across all tested parallelism degrees, confirming that parallel replication provides meaningful benefits even when facing coordination challenges.
The primary scaling limitation appears to be target PostgreSQL lock contention beyond degree 32. System CPU grows to 83.2% at degree 64, meaning only 16.8% of CPU performs productive work. Interestingly, degree 128 continues to improve absolute performance (67s vs 92s) even as total CPU decreases from 4,410% to 3,294%, with network saturation acting as an accidental rate governor that moderates lock contention intensity.
Source PostgreSQL and FastTransfer appear to be victims of backpressure rather than independent bottlenecks. FastTransfer demonstrates the best scaling efficiency (20.2x speedup, 15.8% efficiency), while source processes spend most time waiting for target acknowledgments. Resolving target lock contention would likely improve their performance further.
6.2 Why Additional Tuning Cannot Help
The target table is already optimally configured (UNLOGGED, no indexes, no constraints, no triggers). PostgreSQL configuration includes all recommended bulk loading optimizations (80GB shared_buffers, huge pages, io_uring, fsync=off). Despite this, system CPU remains at 70-84% at high degrees.
The bottleneck appears to be architectural, not configurational:
- Buffer pool partition locks are hardcoded, not tunable
- Relation extension lock is a single exclusive lock per table by design
- FSM access requires serialization to maintain consistency
No configuration parameter appears able to eliminate these fundamental coordination requirements.
Appendix A: PostgreSQL Configuration
Both PostgreSQL 18 instances were aggressively tuned for maximum bulk loading performance. The configuration represents state-of-the-art optimization with every available parameter tuned for performance.
Target PostgreSQL Configuration (Key Settings)
# Memory allocation
shared_buffers = 80GB              # 31% of 256GB RAM
huge_pages = on                    # vm.nr_hugepages=45000
work_mem = 256MB
maintenance_work_mem = 16GB

# Durability disabled (benchmark only, NOT production)
synchronous_commit = off
fsync = off
full_page_writes = off

# WAL configuration (minimal for UNLOGGED)
wal_level = minimal
wal_buffers = 128MB
max_wal_size = 128GB
checkpoint_timeout = 15min
checkpoint_completion_target = 0.5

# Background writer (AGGRESSIVE)
bgwriter_delay = 10ms              # Down from default 200ms
bgwriter_lru_maxpages = 2000       # 2x default
bgwriter_lru_multiplier = 8.0      # 2x default
bgwriter_flush_after = 0

# I/O configuration (PostgreSQL 18 optimizations)
backend_flush_after = 0
effective_io_concurrency = 400     # Optimized for NVMe
maintenance_io_concurrency = 400
io_method = io_uring               # NEW PG18: async I/O
io_max_concurrency = 512           # NEW PG18
io_workers = 8                     # NEW PG18: up from default 3

# Worker processes
max_worker_processes = 128
max_parallel_workers = 128

# Autovacuum (PostgreSQL 18)
autovacuum = on
autovacuum_worker_slots = 32       # NEW PG18: runtime adjustment
autovacuum_max_workers = 16
autovacuum_vacuum_cost_delay = 0   # No throttling

# Query tuning
enable_partitionwise_join = on
enable_partitionwise_aggregate = on
random_page_cost = 1.1             # NVMe SSD
effective_cache_size = 192GB       # ~75% of RAM
Table Configuration
The target table eliminates all overhead sources:
- UNLOGGED: No WAL write, flush, or archival overhead
- No indexes: Eliminates 50-80% of bulk load cost
- No primary key: No index maintenance or uniqueness checking
- No constraints: No foreign key, check, or unique validation
- No triggers: No trigger execution overhead
This represents the absolute minimum overhead possible. The fact that severe lock contention persists suggests the bottleneck lies in PostgreSQL’s buffer management and relation extension architecture rather than higher-level features.
PostgreSQL 18 New Features Utilized
- io_uring: Improved async I/O on Linux kernel 5.1+ (Ubuntu 24.04 ships with kernel 6.8)
- io_max_concurrency: Fine-grained I/O parallelism control, utilizing all 128 vCPUs
- io_workers: Increased from default 3 to 8 for better NVMe parallelism
- autovacuum_worker_slots: Dynamic autovacuum worker management without restart
These PostgreSQL 18 enhancements provide measurable I/O efficiency improvements, but the fundamental architectural limitation of concurrent writes to a single table persists.
About FastTransfer
FastTransfer is a commercial high-performance data migration tool developed by arpe.io. It provides parallel data transfer capabilities across multiple database platforms including PostgreSQL, MySQL, Oracle, SQL Server, ClickHouse, and DuckDB.
Key Features:
- Advanced parallelization strategies for optimal performance
- Cross-platform compatibility with major databases
- Flexible configuration for various data migration scenarios
- Production-ready with comprehensive logging and monitoring
For licensing information, support options, and to request a trial, visit the official documentation.