Performance Analysis of Parallel Data Replication Between Two PostgreSQL 18 Instances on OVH

Introduction
Parallel data replication between PostgreSQL instances presents unique challenges at scale, particularly when attempting to maximize throughput on high-performance cloud infrastructure. FastTransfer is a commercial data migration tool designed to leverage advanced parallelization strategies for efficient data movement. This post provides a performance analysis of FastTransfer transferring 77GB of data between two PostgreSQL 18 instances on OVH c3-256 servers, examining CPU, disk I/O, and network bottlenecks across parallelism degrees from 1 to 128.
Test Configuration
The test dataset consists of the TPC-H SF100 lineitem table (~600M rows, ~77GB), configured as an UNLOGGED table without indexes, constraints, or triggers. Both instances were tuned for bulk loading operations, with all durability features disabled, large memory allocations, and PostgreSQL 18’s io_uring support enabled (configuration details in Appendix A). Despite this comprehensive optimization, it appears that lock contention emerges at high parallelism degrees, limiting scalability.
Testing was performed at eight parallelism degrees, executed sequentially in a progressive loading pattern: 1, 2, 4, 8, 16, 32, 64, and 128, with each step doubling to systematically increase load. Each configuration was run only once rather than following standard statistical practice of multiple runs with mean, standard deviation, and confidence intervals. This single-run approach was adopted after preliminary tests showed minimal variation between successive runs, indicating stable and reproducible results under these controlled conditions.
OVH Infrastructure Setup
The test environment consists of two identical OVH cloud instances designed for heavy workloads:
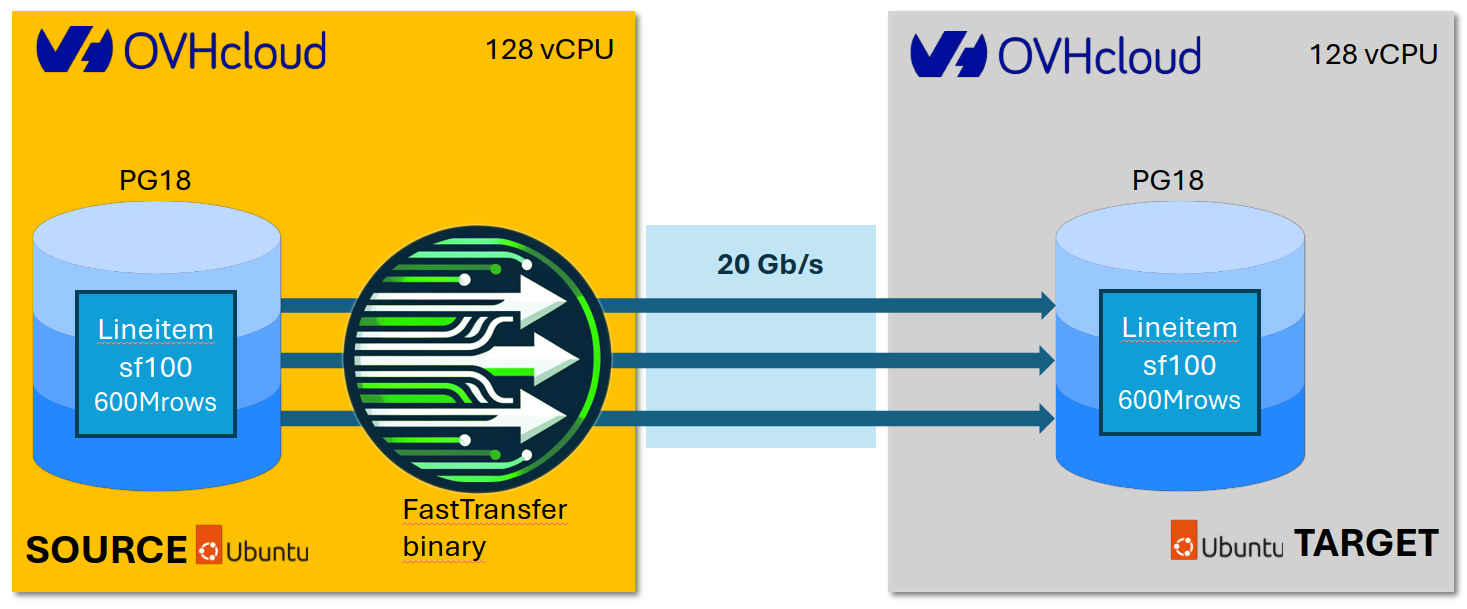
Figure 1: OVH Infrastructure Architecture - The test setup consists of two identical c3-256 instances (128 vCores, 256GB RAM, 400GB NVMe) running PostgreSQL 18 on Ubuntu 24.04. The source instance contains the TPC-H SF100 lineitem table. FastTransfer orchestrates parallel data replication across a 20 Gbit/s vrack private network connection to the target instance. Both instances are located in the Paris datacenter (eu-west-par-c) for minimal network latency.
Hardware Configuration:
- Instance Type: OVH c3-256
- Memory: 256GB RAM
- CPU: 128 vCores @ 2.3 GHz
- Storage:
- Target: 400GB local NVMe SSD
- Source: OVH Block Storage (high-speed-gen2 with ~2TB, Bandwidth : 1 GB/s, Performance : 20,000 IOPS)
- Network: 20 Gbit/s vrack (2.5 GB/s)
The source instance PostgreSQL data directory resides on attached OVH Block Storage rather than local NVMe. This asymmetric storage configuration does not affect the analysis conclusions, as the source PostgreSQL instance exhibits backpressure behavior rather than storage-limited performance.
Software Stack:
- OS: Ubuntu 24.04.3 LTS with Linux kernel 6.8
- PostgreSQL: Version 18.0, with
io_uring, huge pages (vm.nr_hugepages=45000) - FastTransfer: Version 0.13.12
Infrastructure Performance Baseline:
- Network: 20.5 Gbit/s (2.56 GB/s) verified with iperf3
- Target Disk Sequential Write: 3,741 MB/s (FIO benchmark with 128K blocks)
- Target Disk Random Write: 88.2 MB/s, 22,600 IOPS (FIO, 4K blocks)
Overall Performance
FastTransfer achieves strong absolute performance, transferring 77GB in just 67 seconds at degree 128, equivalent to 1.15 GB/s sustained throughput. The parallel replication process scales continuously across all tested degrees, with total elapsed time decreasing from 878 seconds (degree 1) to 67 seconds (degree 128). The system delivers consistent real-world performance improvements even at large parallelism levels, though lock contention on the target PostgreSQL instance appears to increasingly limit scaling efficiency beyond degree 32.
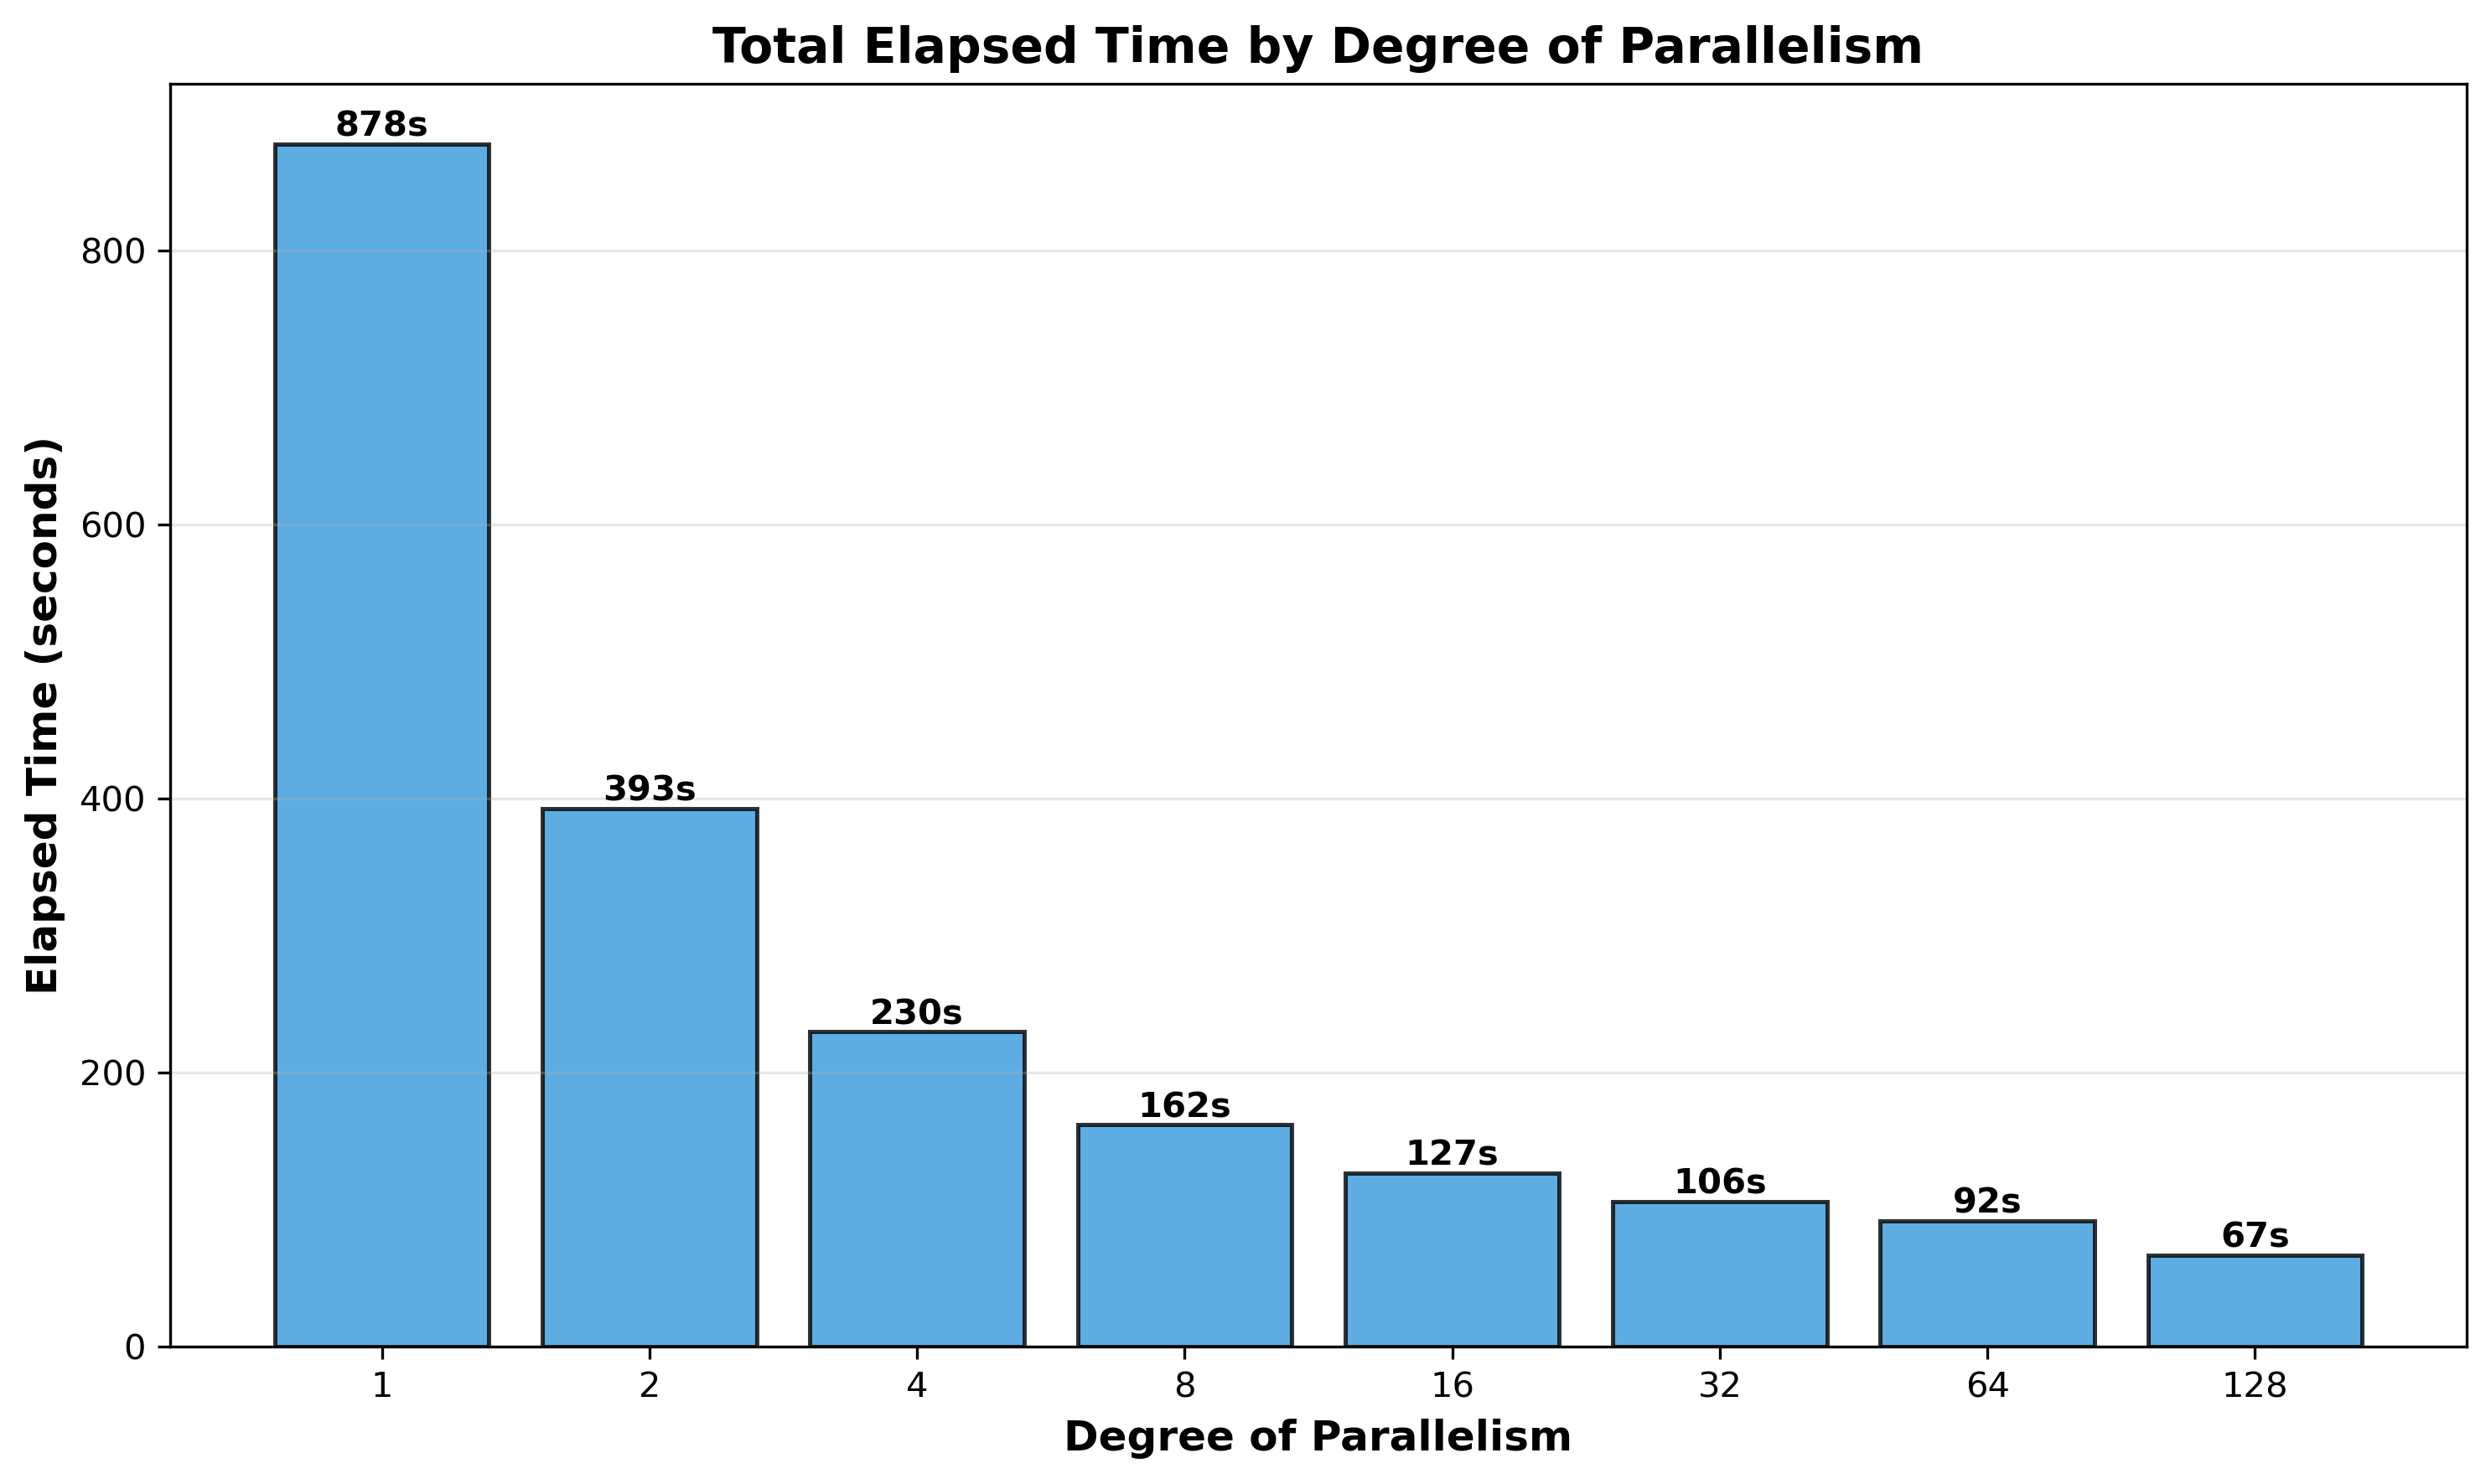
Figure 2: Total Elapsed Time by Degree of Parallelism - Wall-clock time improves continuously across all tested degrees, from 878 seconds (degree 1) to 67 seconds (degree 128). Performance gains remain positive throughout, though the rate of improvement diminishes beyond degree 32 due to increasing lock contention.
1. CPU Usage Analysis
1.1 Mean and Peak CPU Usage
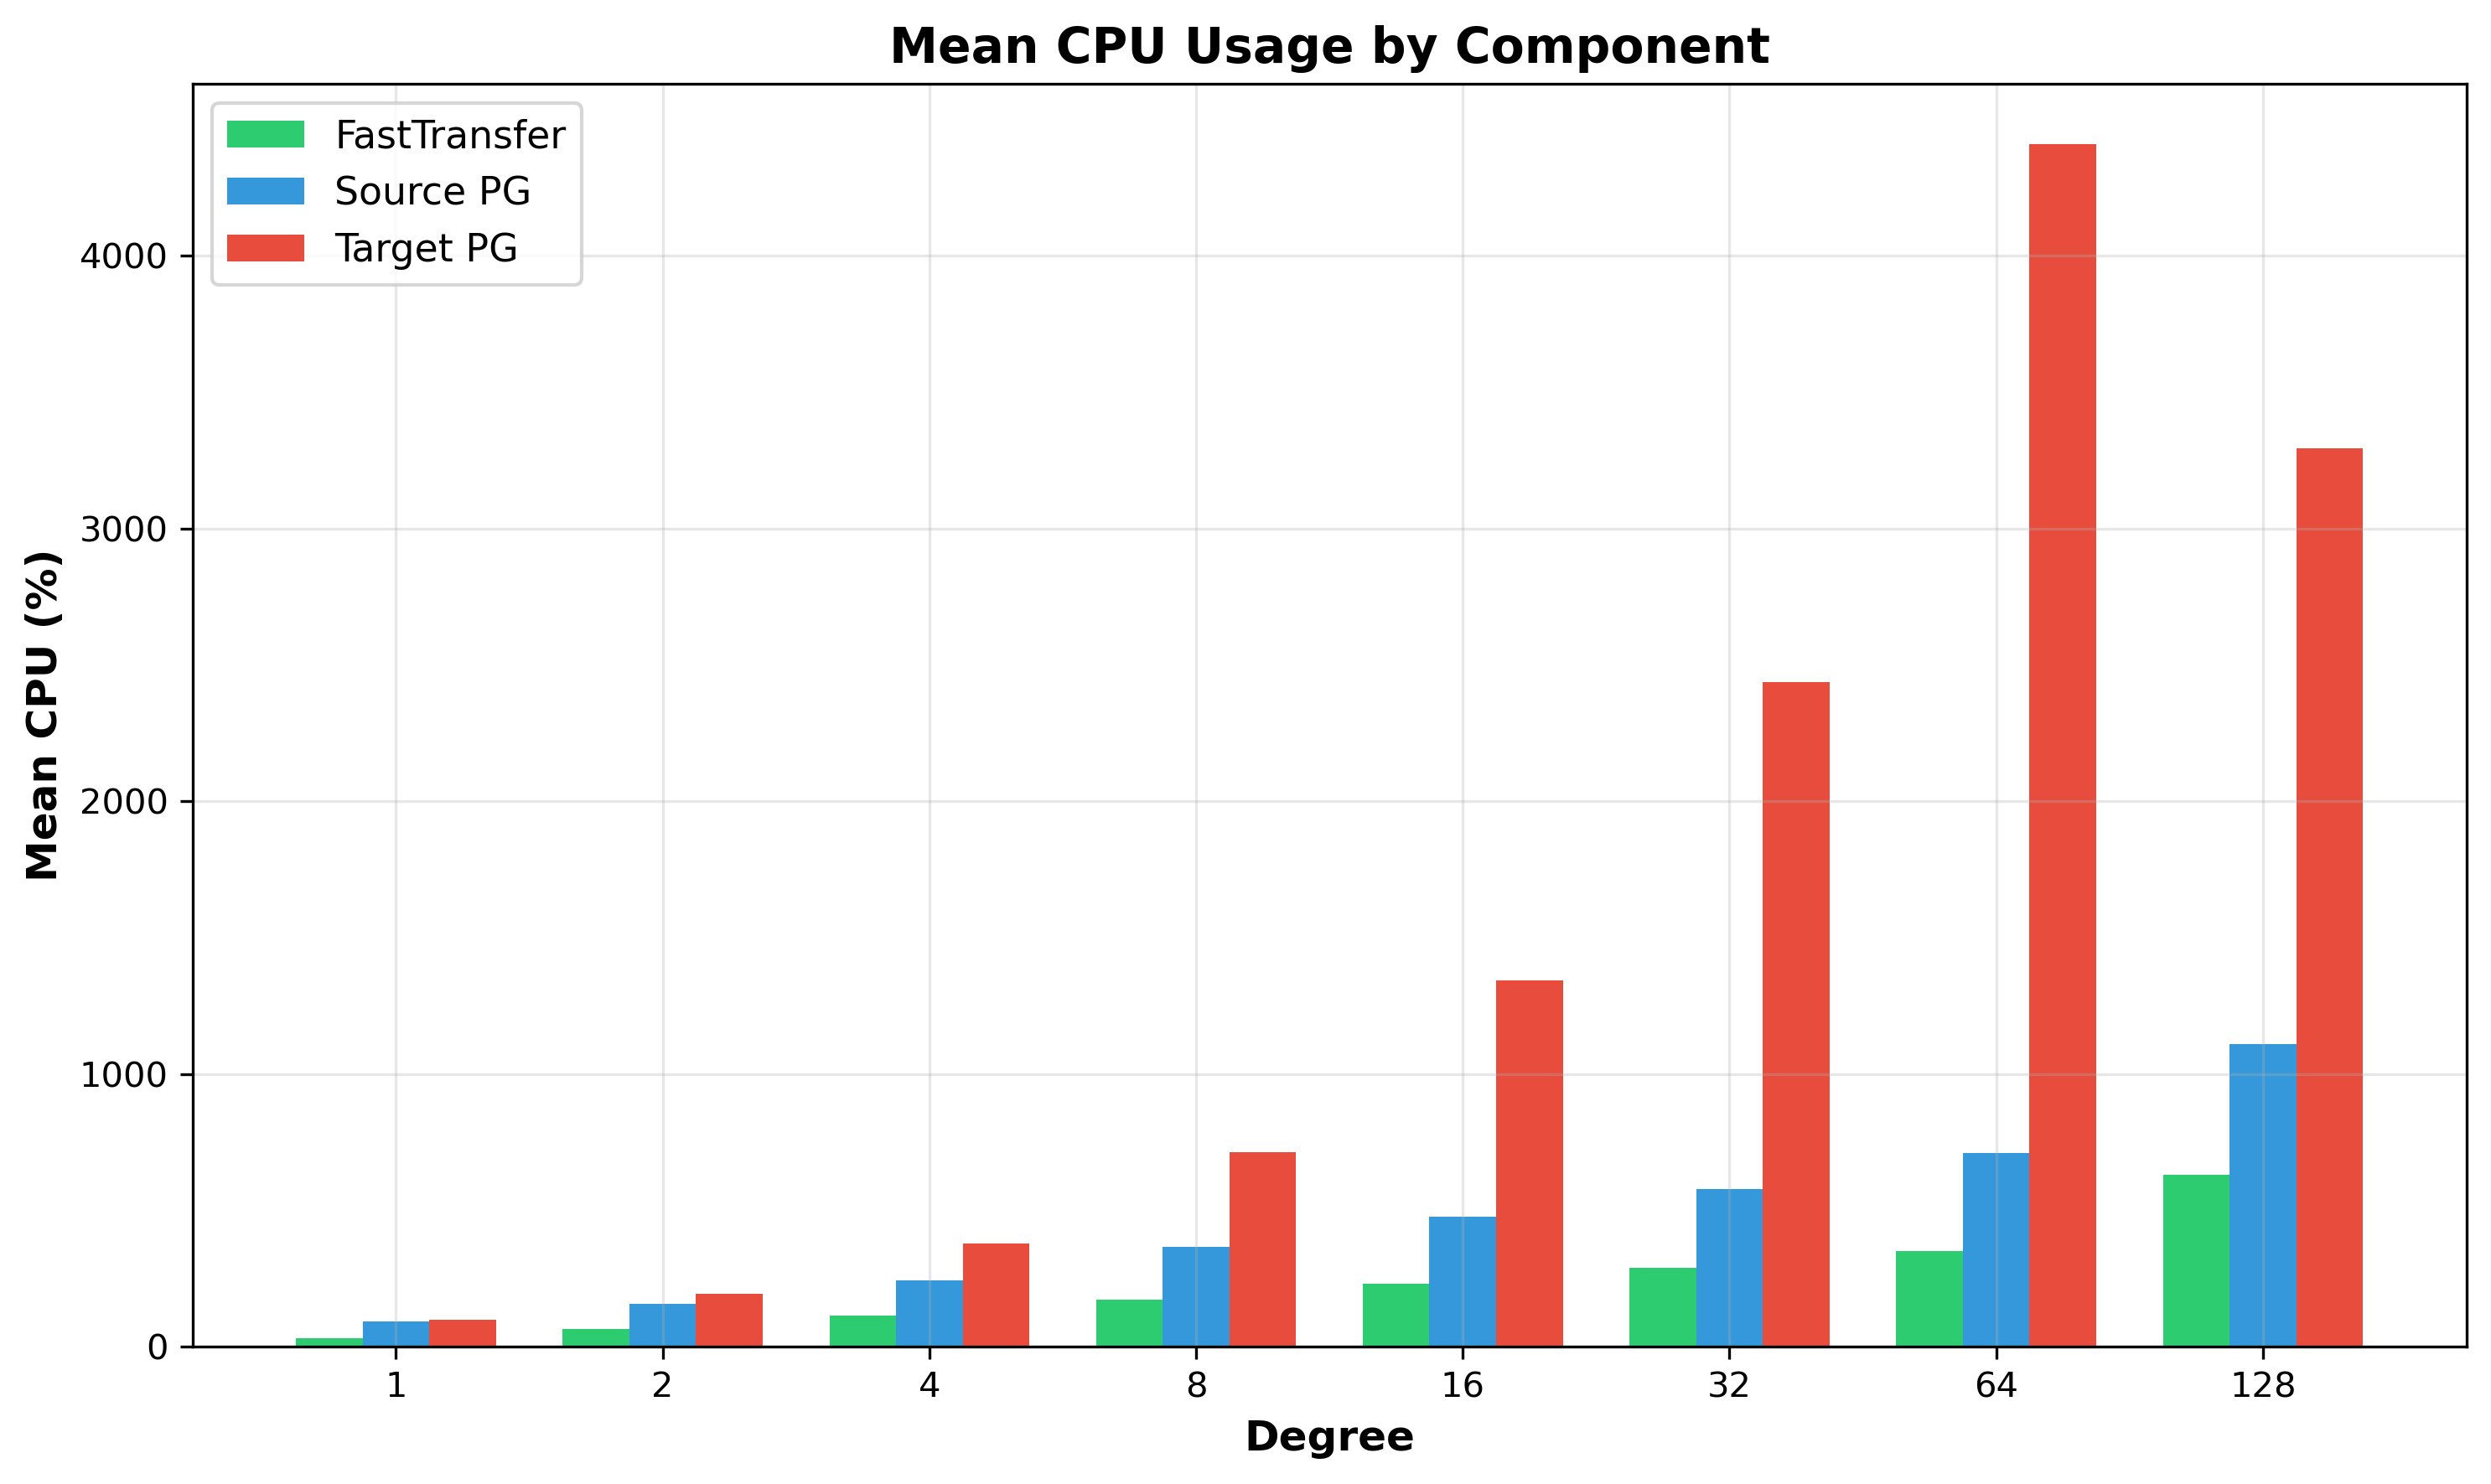
Figure 3: Mean CPU Usage by Component - Target PostgreSQL (red) dominates resource consumption at high parallelism, while source PostgreSQL (blue) reaches around 12 cores.
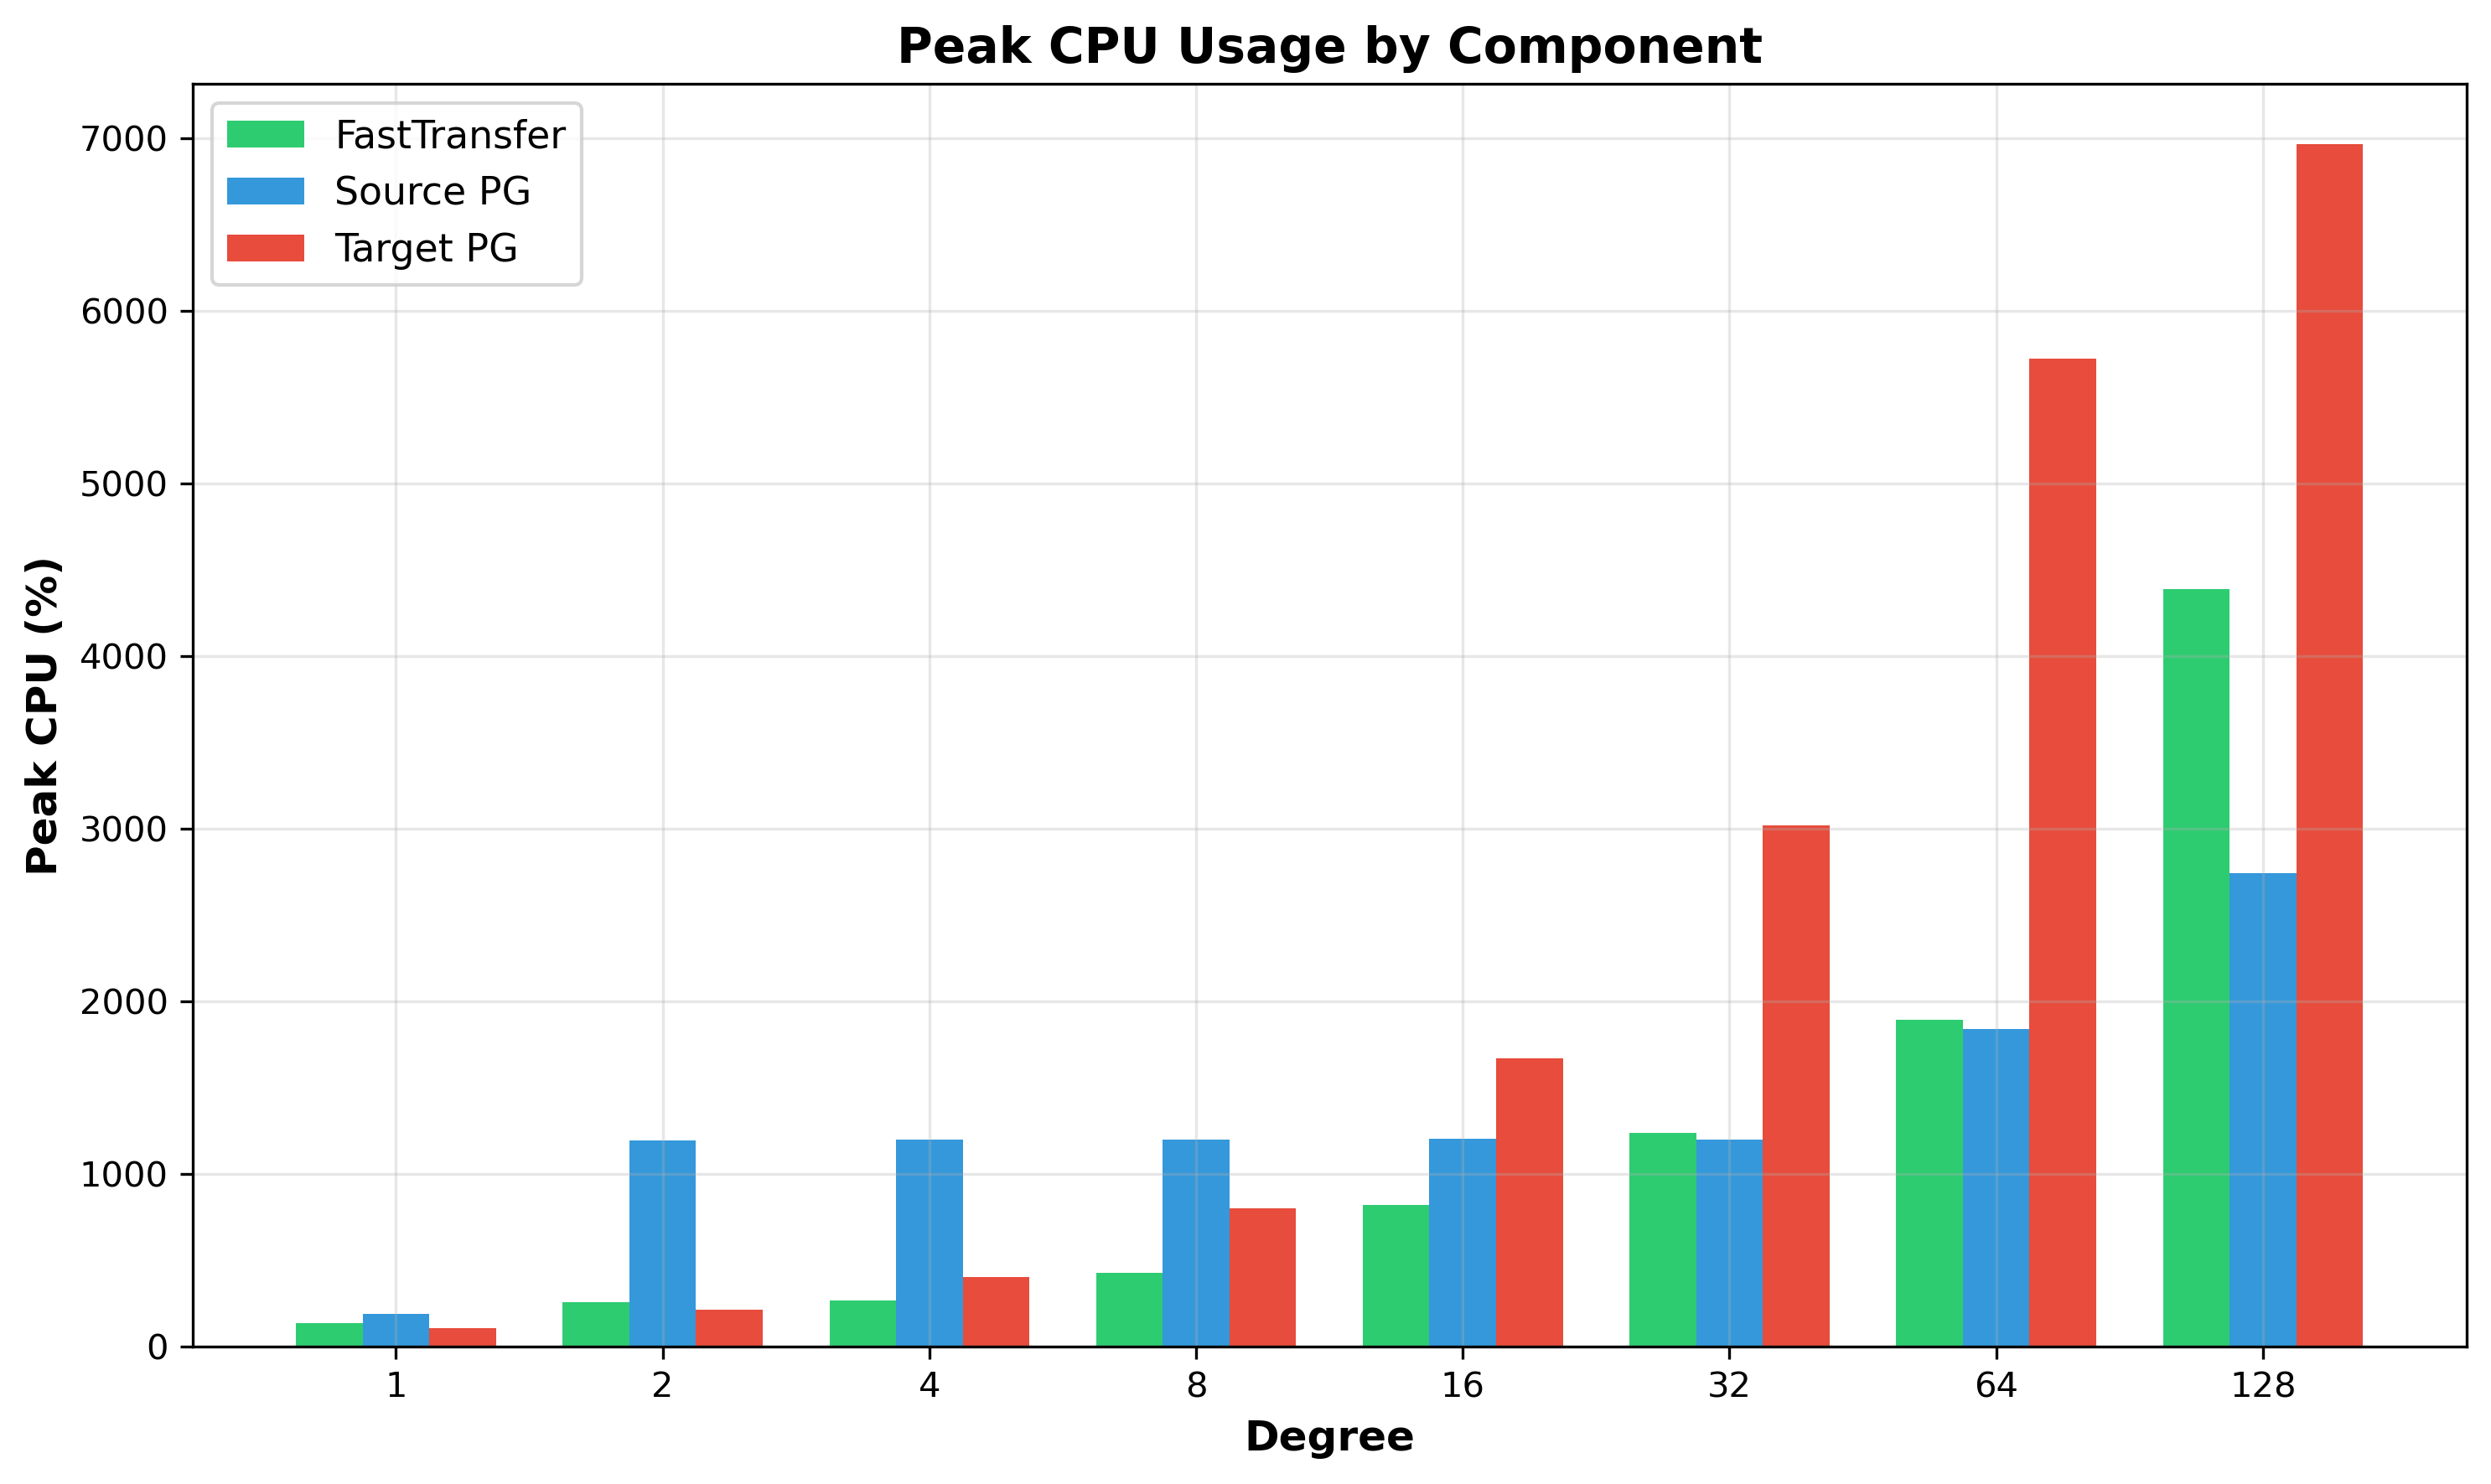
Figure 4: Peak CPU Usage by Component - Target PostgreSQL exhibits high peak values (~6,969% at degree 128). The large spikes combined with relatively lower mean values indicate high variance, characteristic of processes alternating between lock contention and productive work.
Component Scaling Summary:
| Component | Degree 1 | Degree 128 | Speedup | Efficiency |
|---|---|---|---|---|
| Source PostgreSQL | 93% | 1,175% | 11.9x | 9.3% |
| FastTransfer | 31% | 631% | 20.1x | 15.7% |
| Target PostgreSQL | 98% | 3,294% | 33.6x | 26.3% |
Source PostgreSQL’s poor scaling appears to stem from backpressure: FastTransfer’s batch-and-wait protocol means source processes send a batch, then block waiting for target acknowledgment. When the target cannot consume data quickly due to lock contention, this delay propagates backward. At degree 128, the source processes collectively use only 11.7 cores (0.11 cores/process), suggesting they’re waiting rather than actively working.
Note also that FastTransfer uses PostgreSQL’s Ctid pseudo-column for table partitioning, which doesn’t allow a perfect distribution, some partitions are smaller than others, causing processes to complete and exit before others.
1.2 FastTransfer
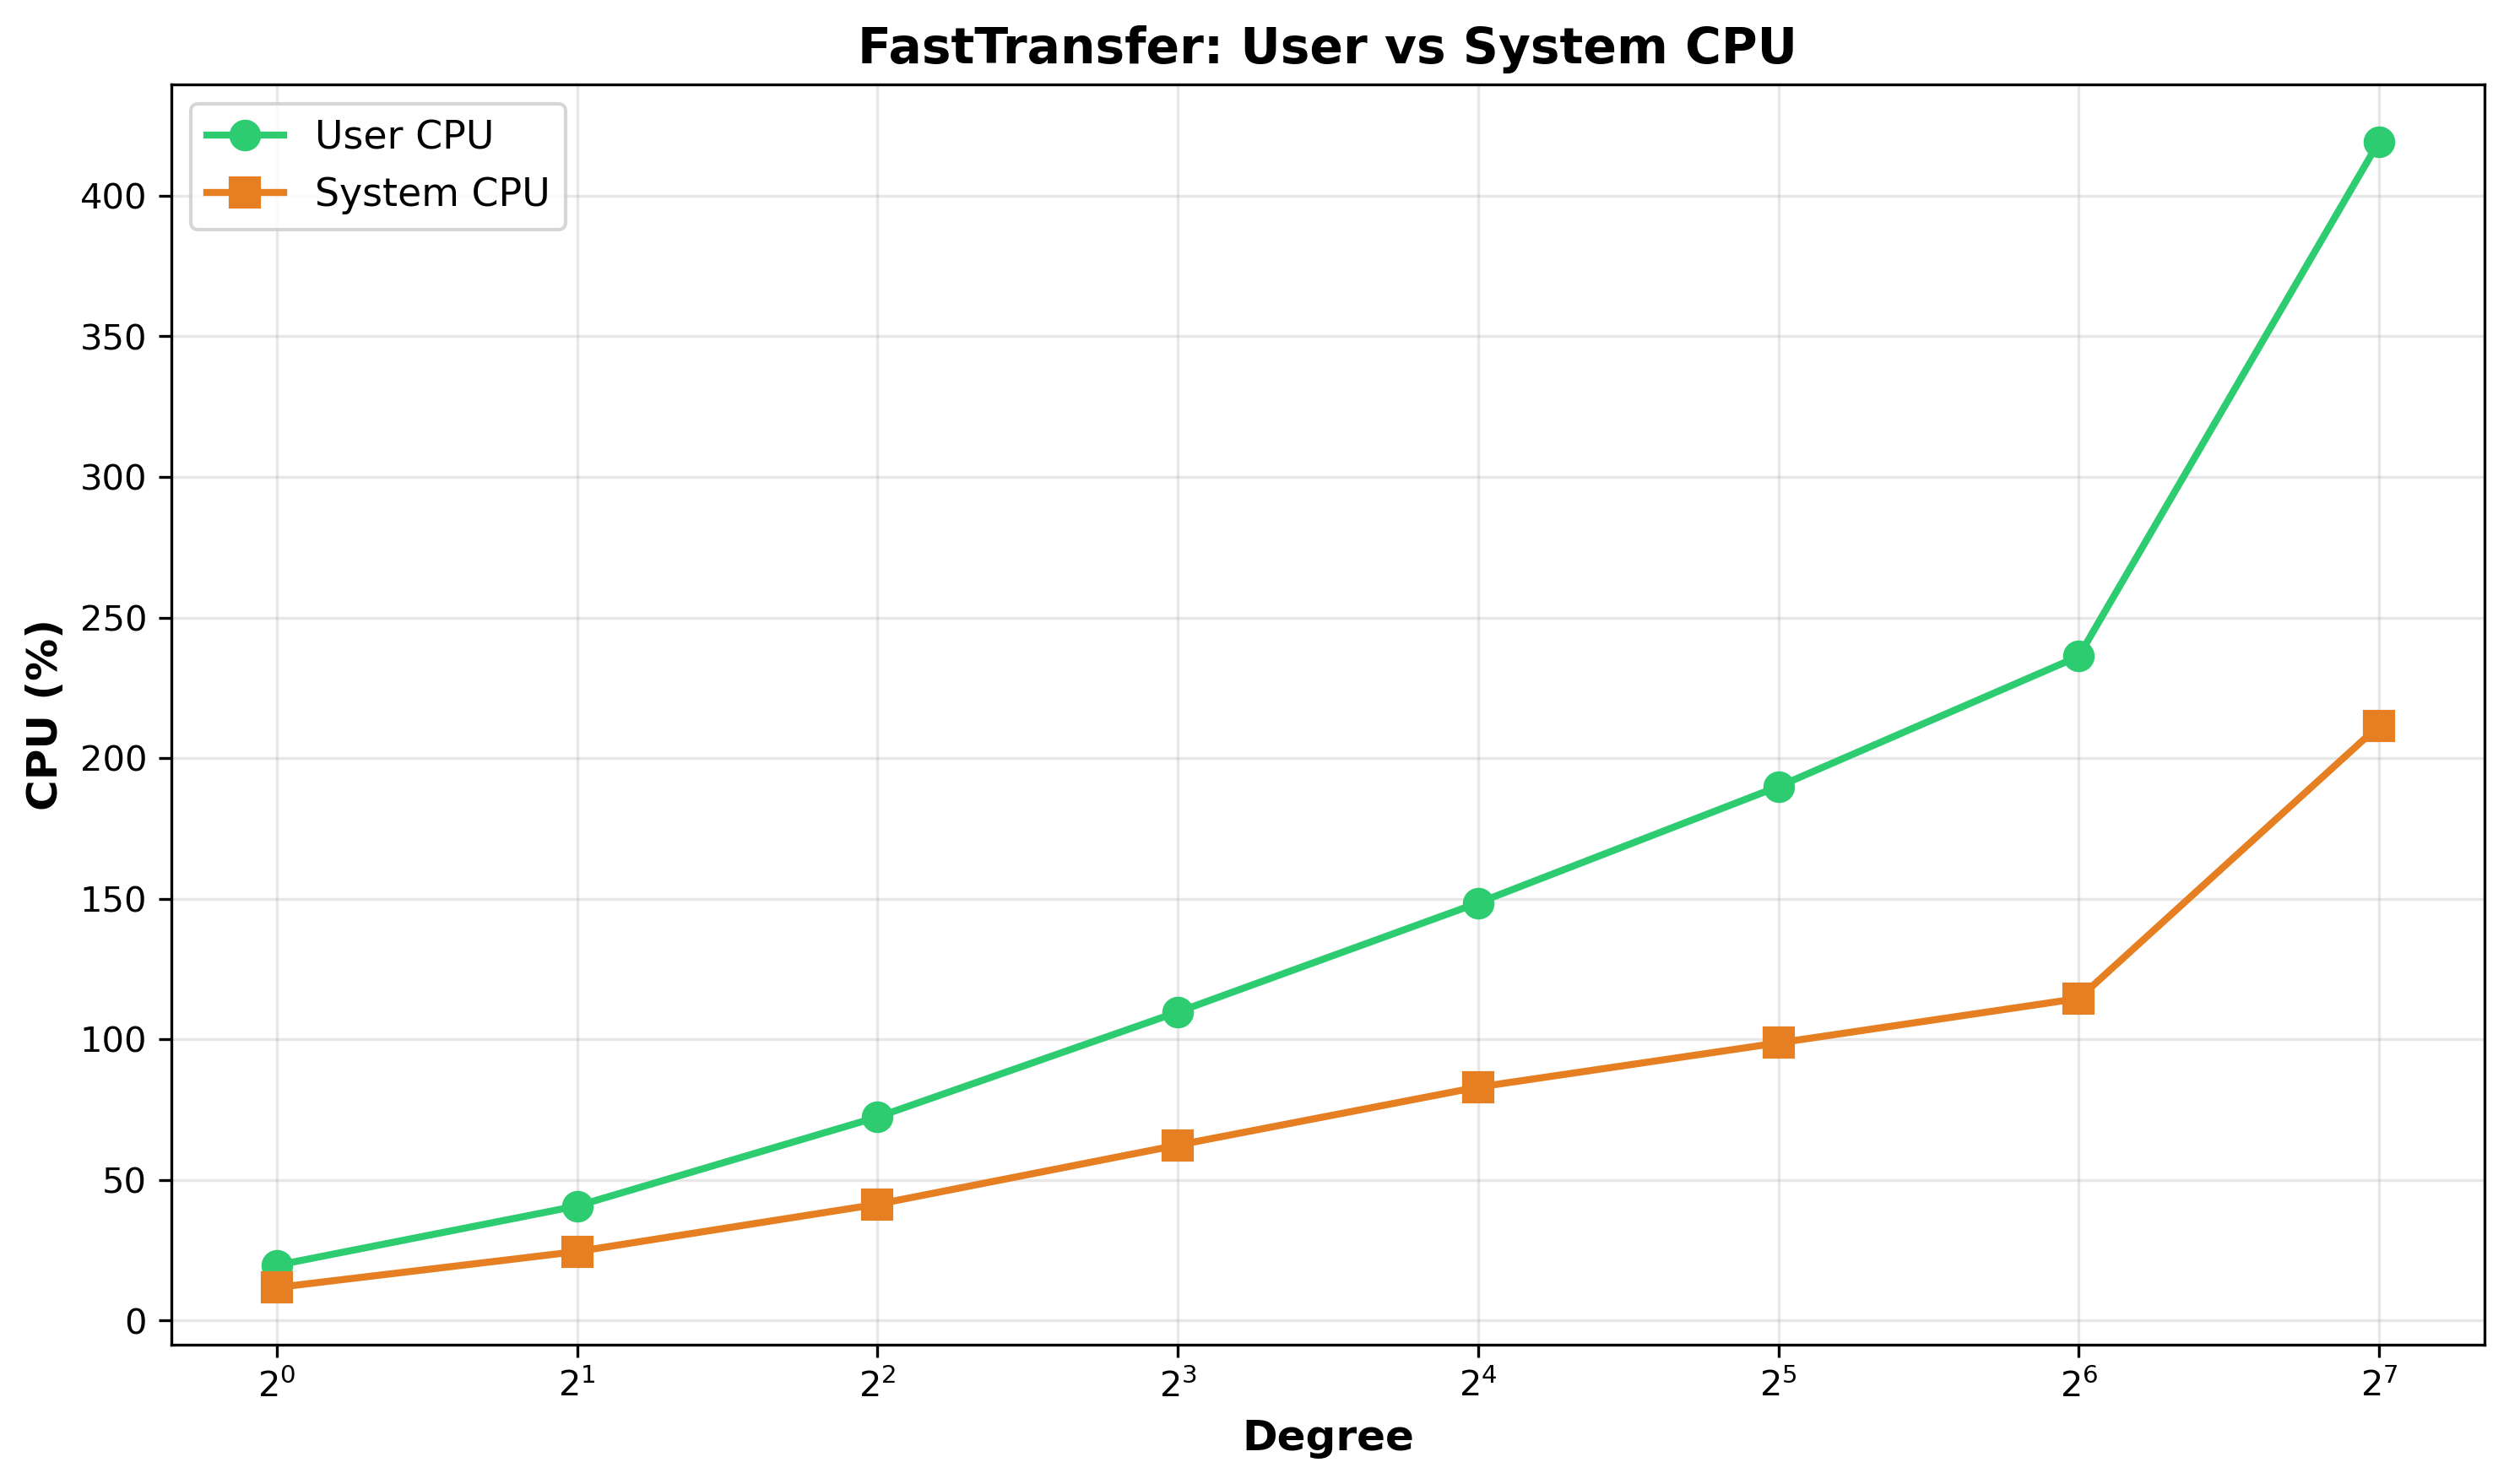
Figure 5: FastTransfer User vs System CPU - At degree 128, FastTransfer uses 419% user CPU (66%) and 212% system CPU (34%).
FastTransfer uses in the present case PostgreSQL’s binary COPY protocol for both source and target (--sourceconnectiontype "pgcopy" and --targetconnectiontype "pgcopy"). Data flows directly from source PostgreSQL’s COPY TO BINARY through FastTransfer to target PostgreSQL’s COPY FROM BINARY without data transformation. FastTransfer acts as an intelligent network proxy coordinating parallel streams and batch acknowledgments, explaining its relatively low CPU usage. This would less be the case if we were transfering data between distinct RDBMS types.
2. The Lock Contention Problem: System CPU Analysis
2.1 System CPU
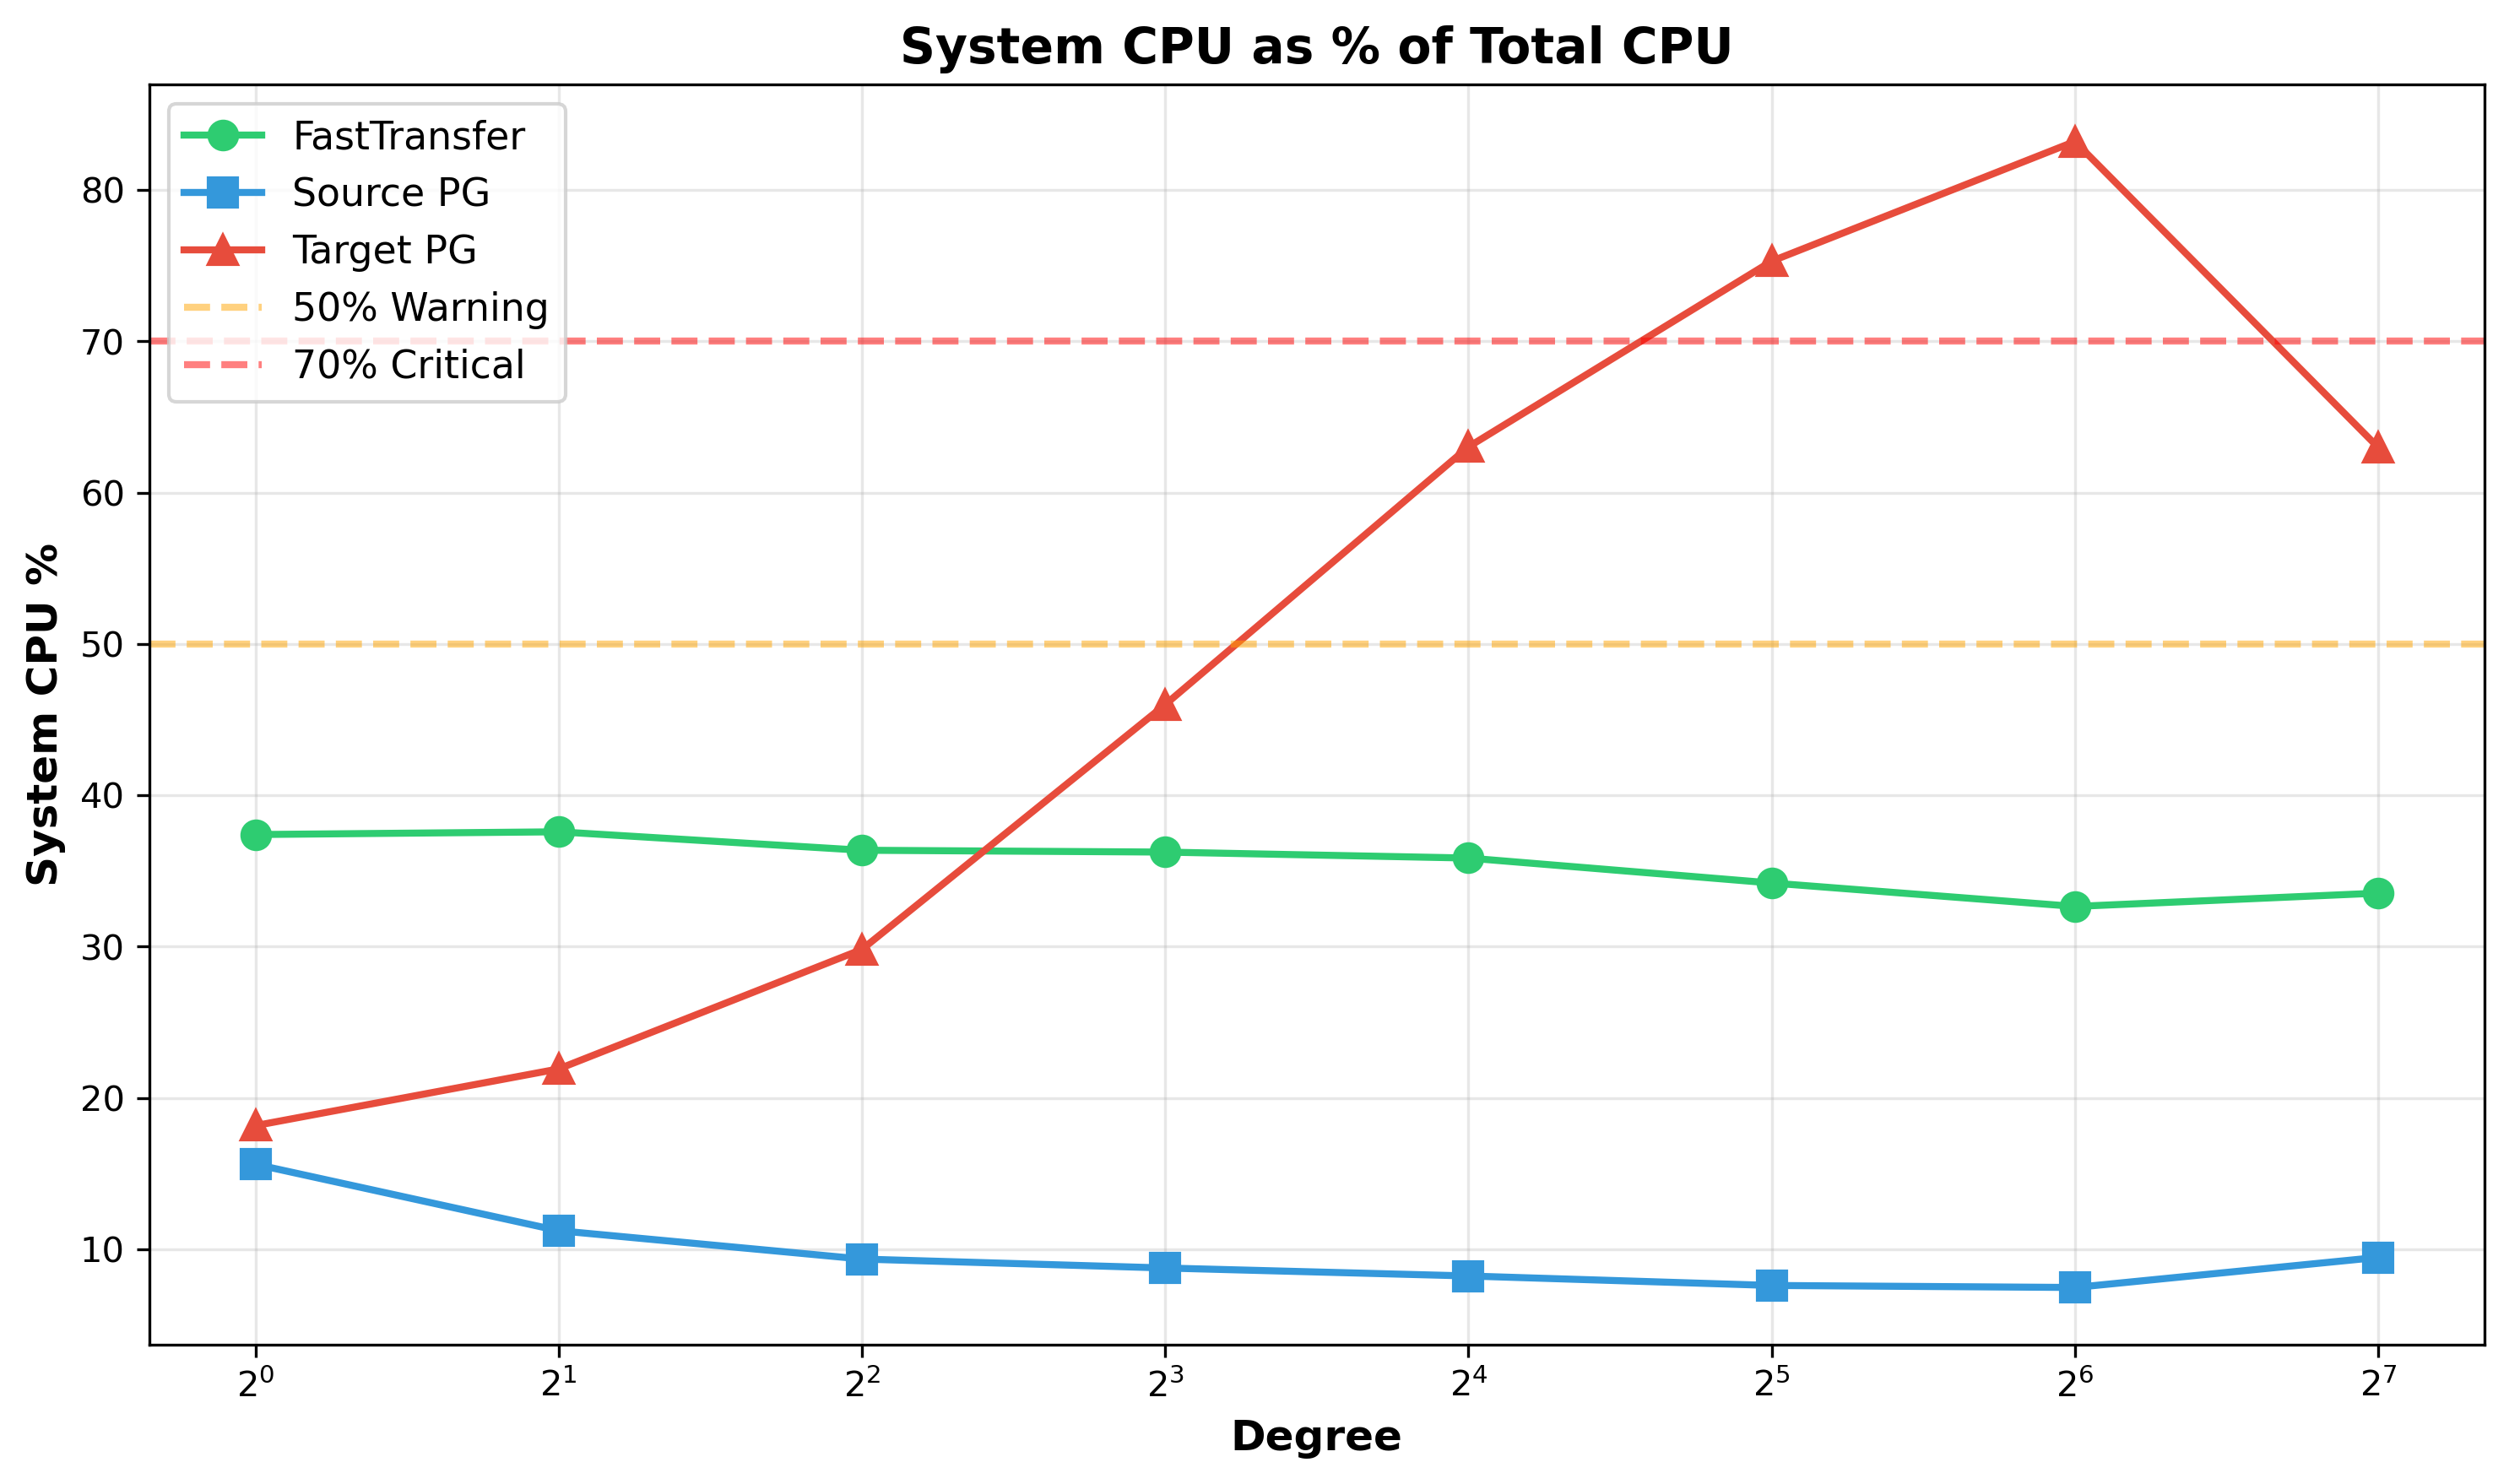
Figure 6: System CPU as % of Total CPU - Target PostgreSQL (red line) crosses the 50% warning threshold at degree 16, exceeds 70% at degree 32, and peaks at 83.9% at degree 64. At this maximum, only 16.2% of CPU time performs productive work while 83.9% appears spent on lock contention and kernel overhead.
CPU time divides into two categories: User CPU (application code performing actual data insertion) and System CPU (kernel operations handling locks, synchronization, context switches, I/O). A healthy system maintains system CPU below 30%.
System CPU Progression:
| Degree | Total CPU | User CPU | System CPU | System % | Productive Work |
|---|---|---|---|---|---|
| 1 | 98% | 80% | 18% | 18.2% | Healthy baseline |
| 16 | 1,342% | 496% | 846% | 63.0% | Warning threshold crossed |
| 32 | 2,436% | 602% | 1,834% | 75.3% | High contention |
| 64 | 4,596% | 743% | 3,854% | 83.9% | Maximum contention |
| 128 | 4,230% | 1,248% | 2,982% | 70.5% | Reduced contention |
At degree 64, processes appear to spend 83.9% of time managing locks rather than inserting data. By degree 128, system CPU percentage unexpectedly decreases to 70.5% for unclear reasons, though absolute performance continues to improve.
2.2 Possible Causes of Lock Contention
The target table was already optimized for bulk loading (UNLOGGED, no indexes, no constraints, no triggers), eliminating all standard overhead sources. So the contention could stem from PostgreSQL’s fundamental architecture:
-
Shared Buffer Pool Locks: All 128 parallel connections compete for buffer pool partition locks to read/modify/write pages.
-
Relation Extension Locks: When the table grows, PostgreSQL requires an exclusive lock (only one process at a time).
-
Free Space Map (FSM) Locks: All 128 writers query and update the FSM to find pages with free space, creating constant FSM thrashing.
3. Distribution and Time Series Analysis
3.1 CPU Distribution
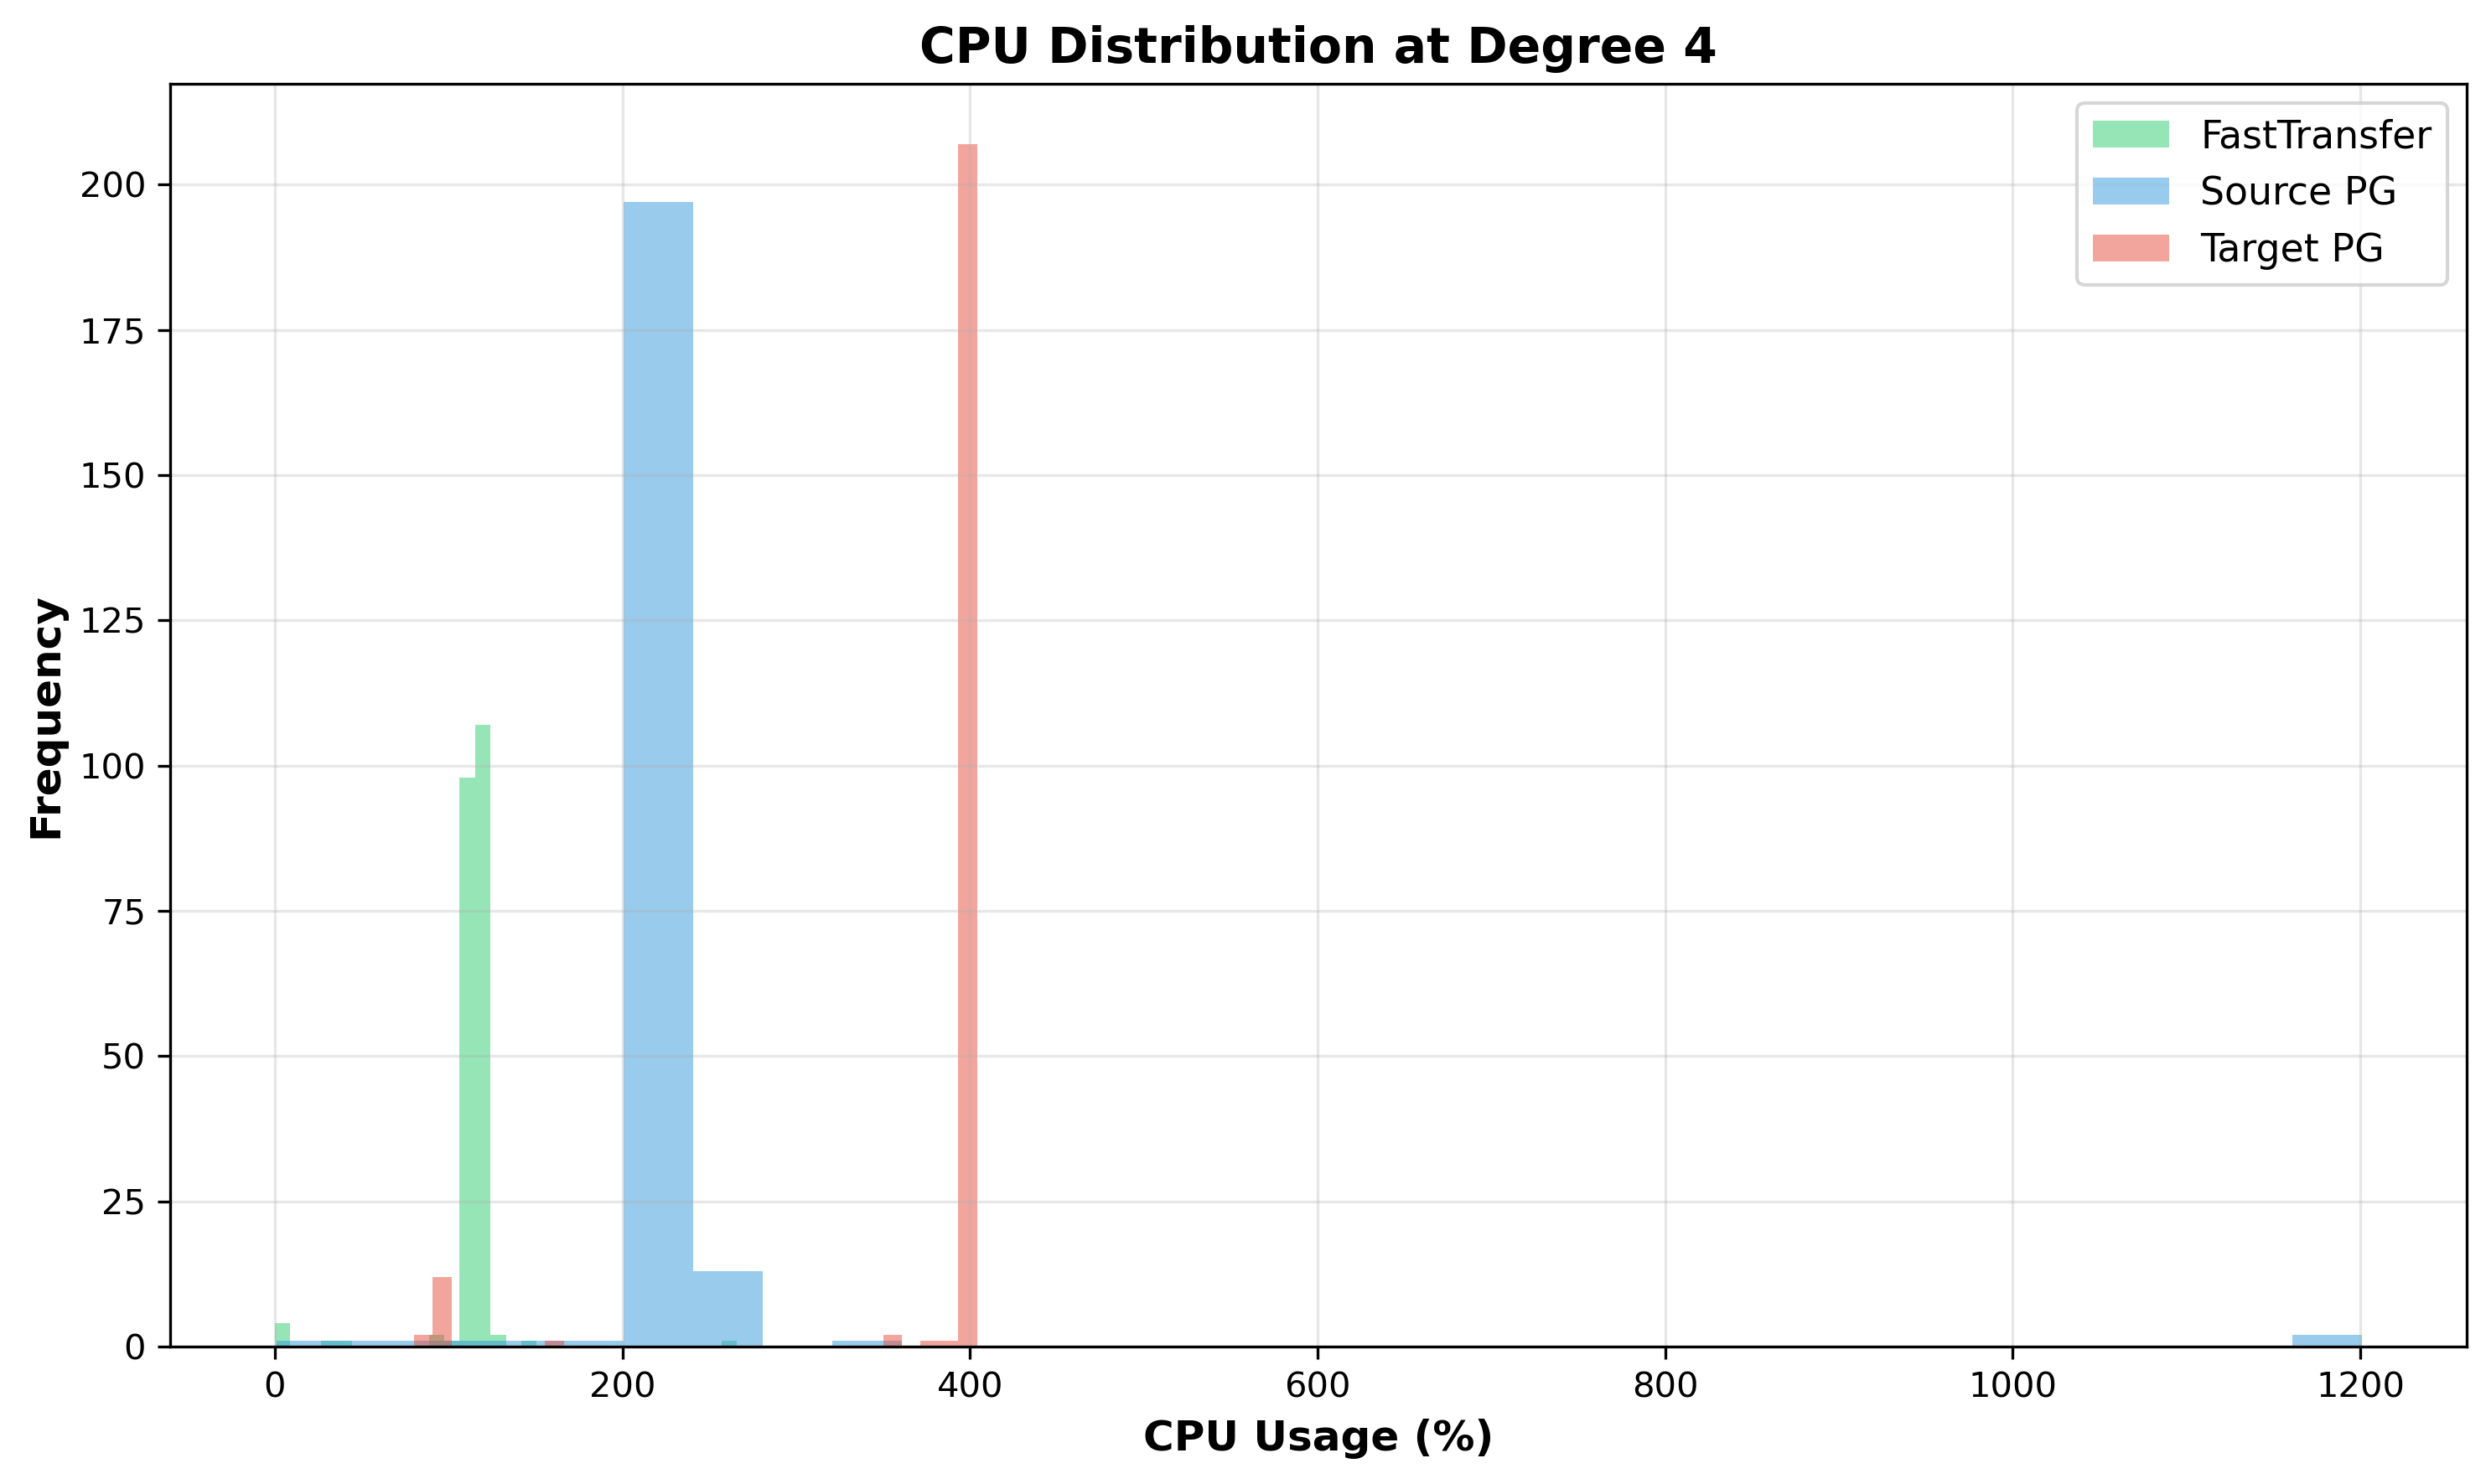
Figure 7: CPU Distribution at Degree 4 - Tight, healthy distributions with small standard deviations. All components operate consistently without significant contention.
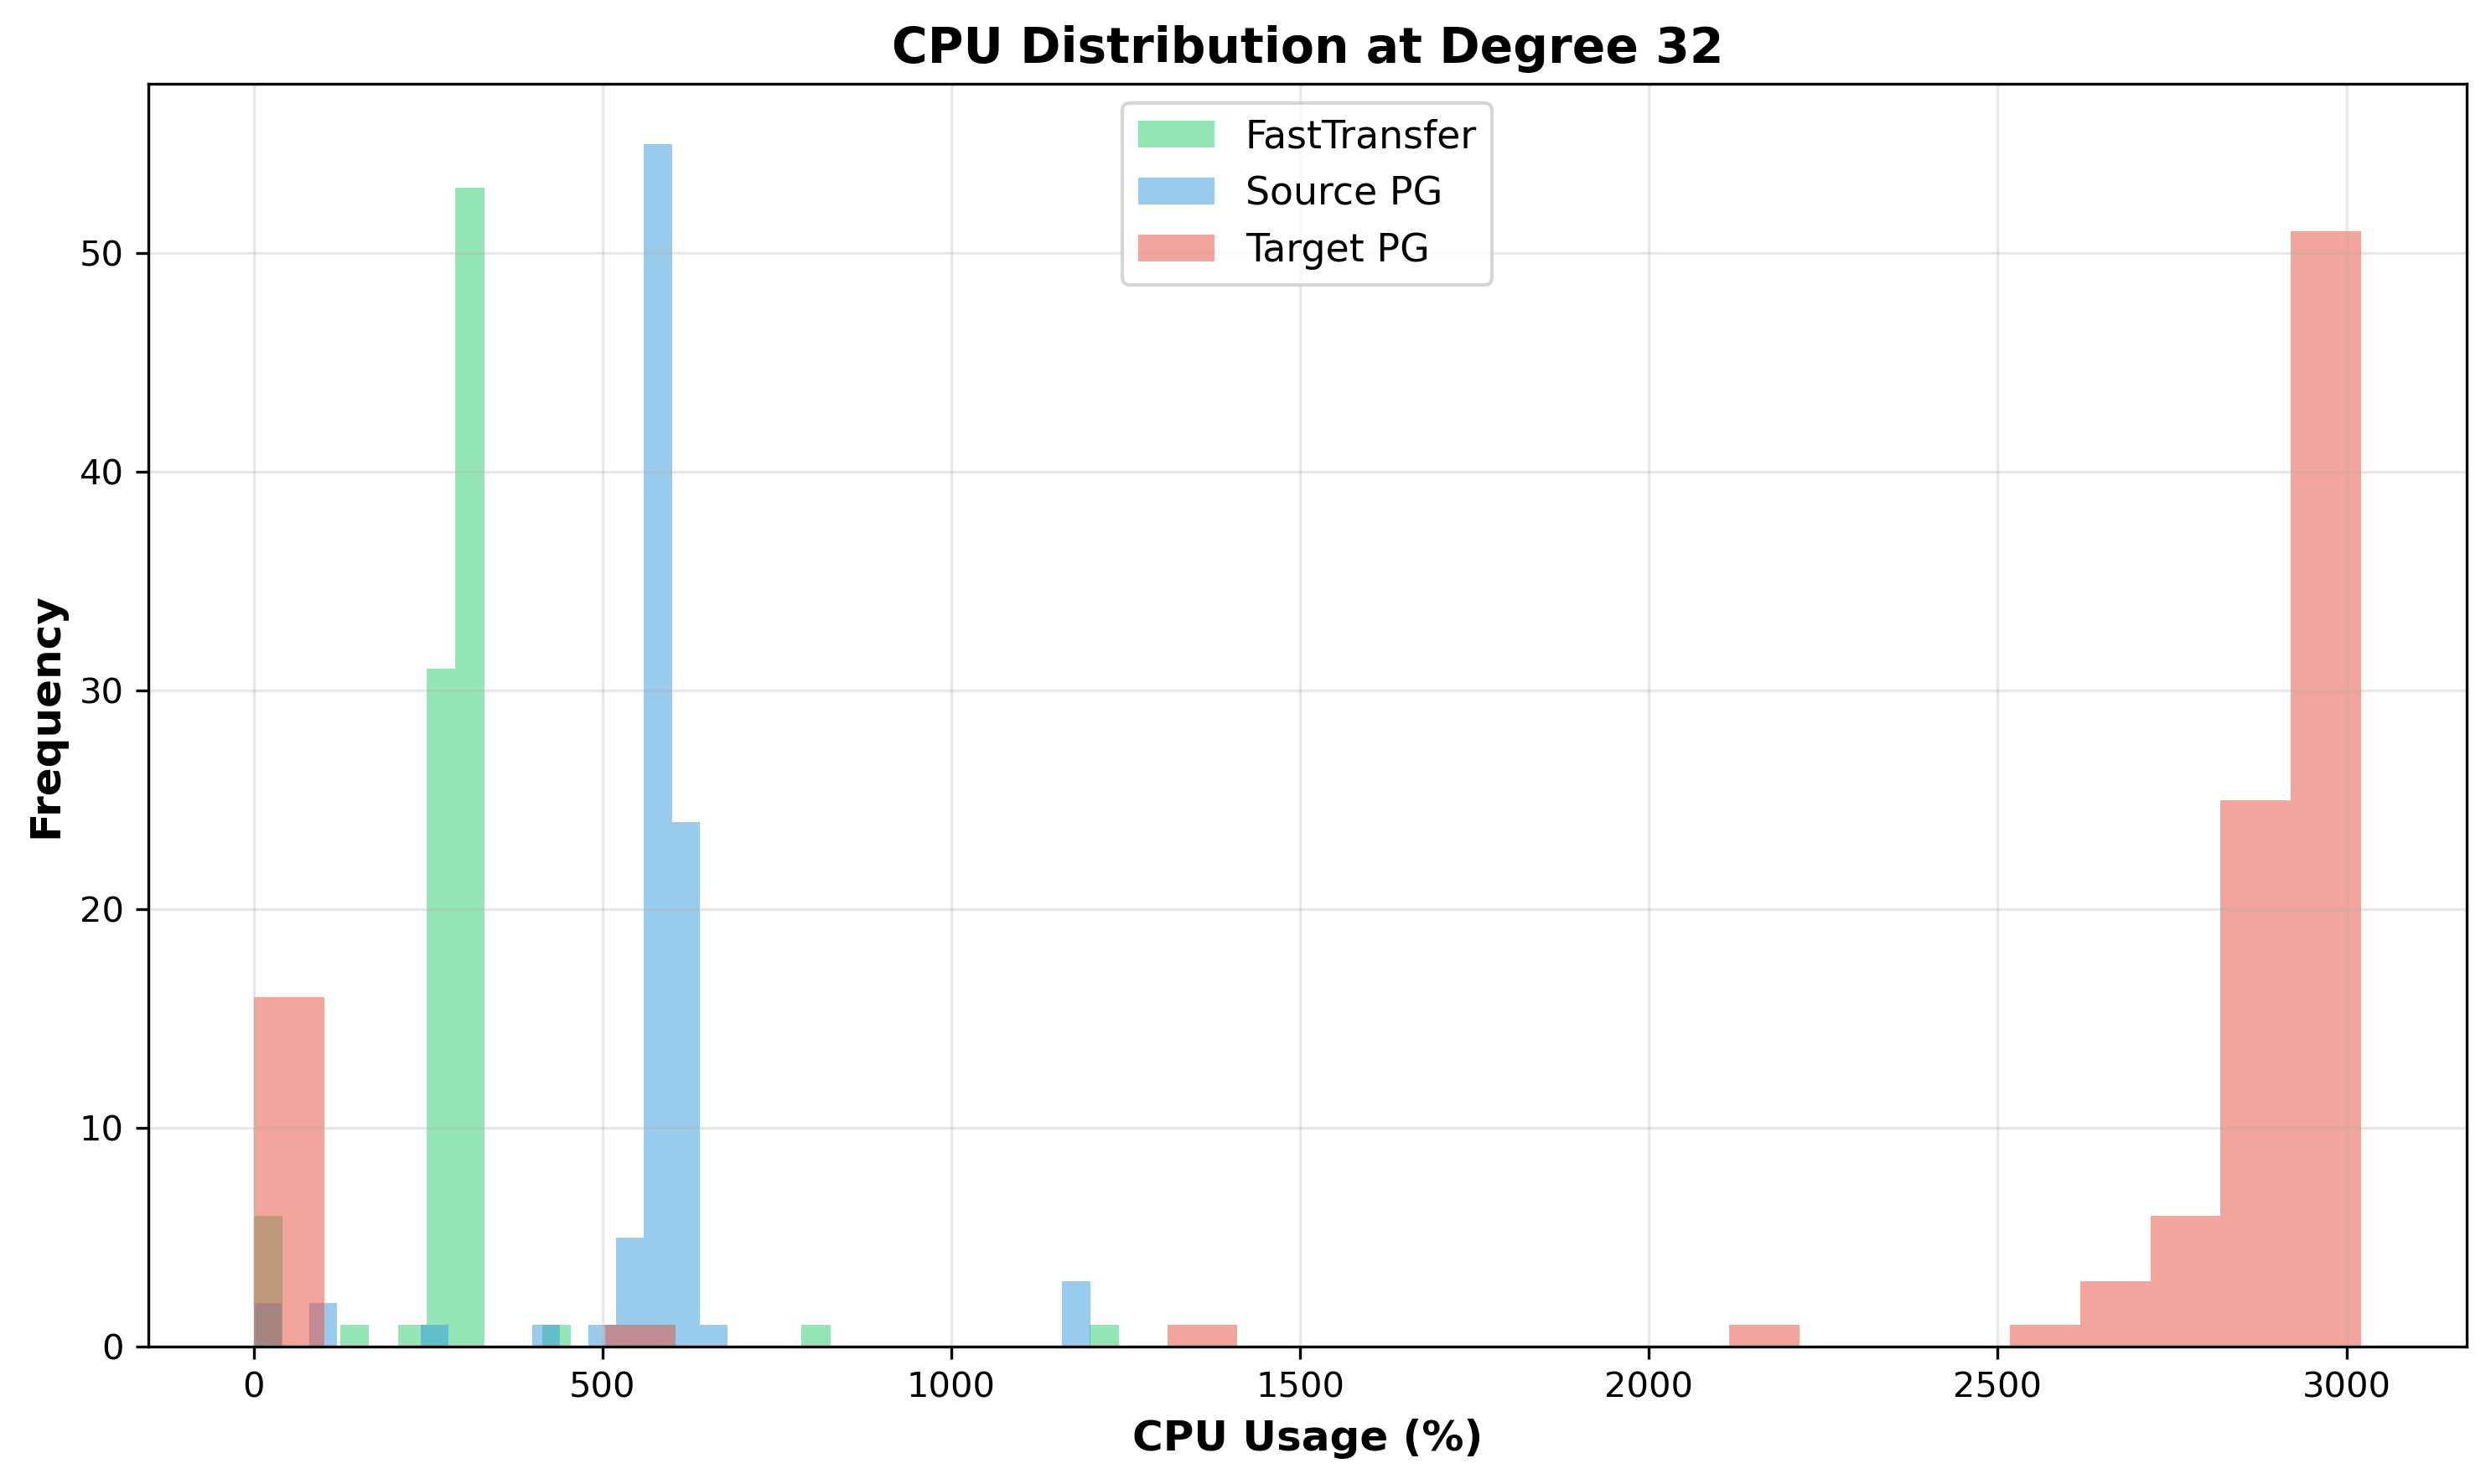
Figure 8: CPU Distribution at Degree 32 - Target PostgreSQL (red) becomes bimodal with wide spread (1000-3000% range), indicating some samples capture waiting processes while others capture active processes. Source (blue) remains relatively tight.
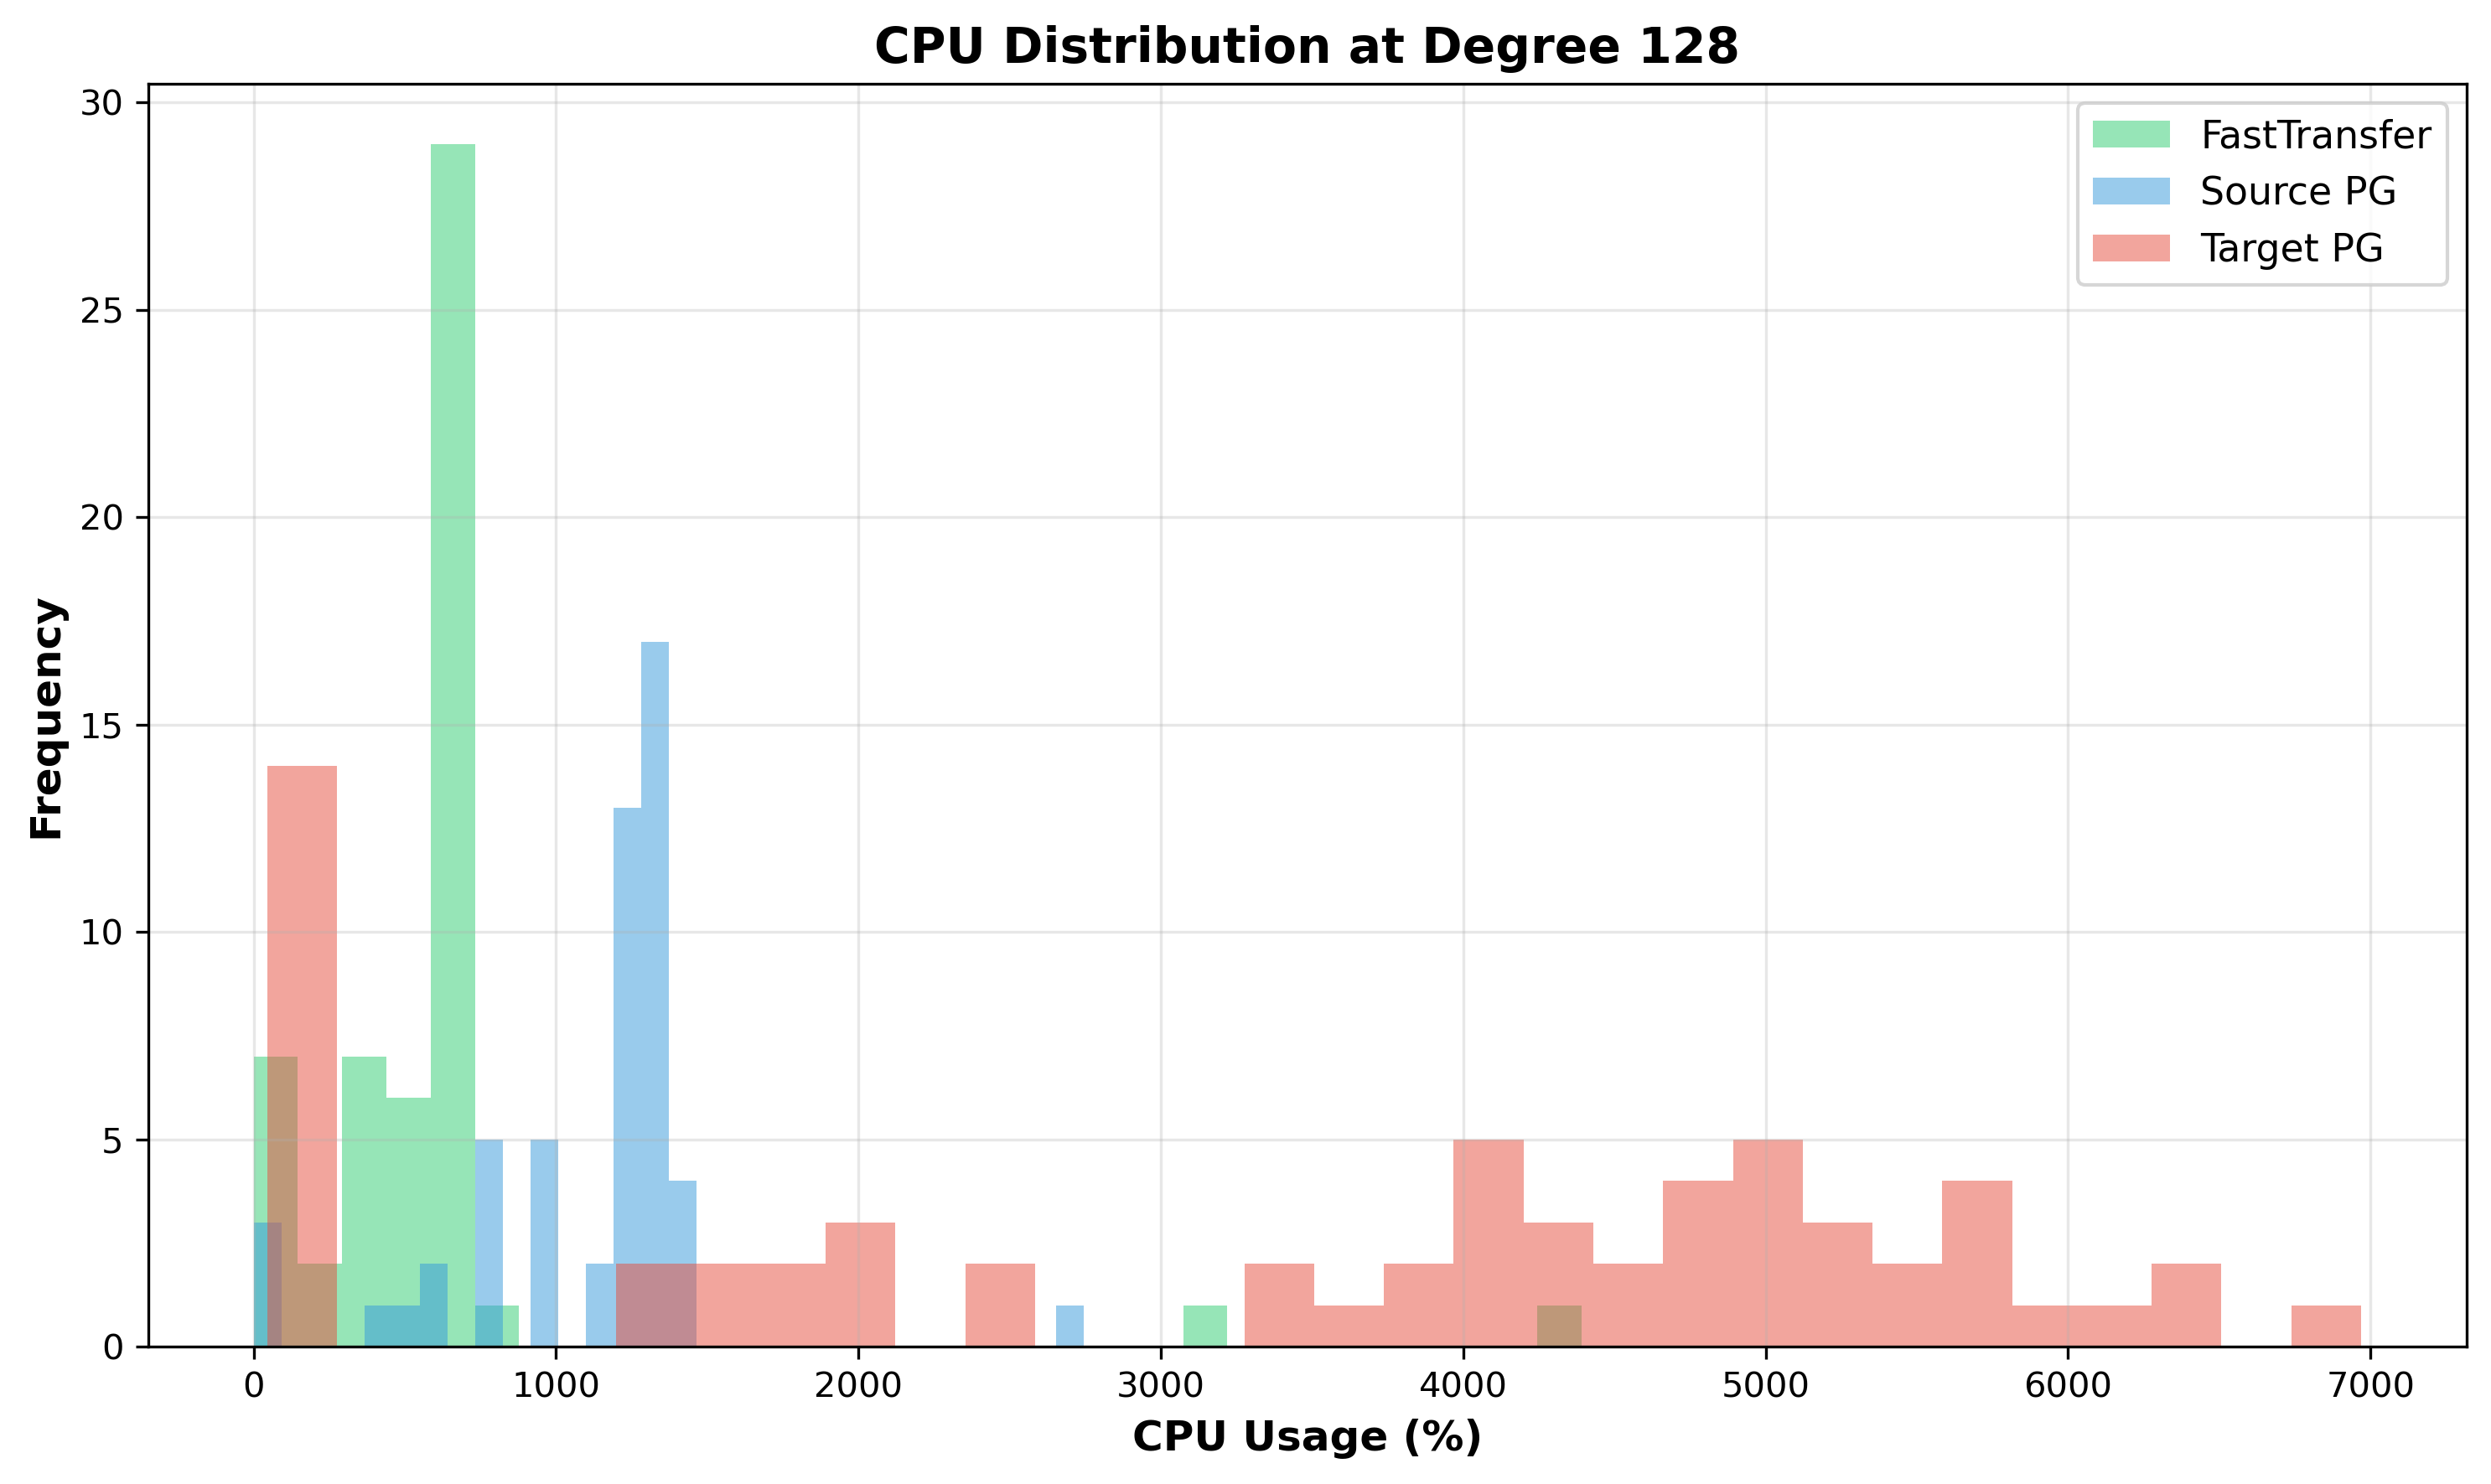
Figure 9: CPU Distribution at Degree 128 - Target PostgreSQL (red) spans nearly 0-10000%, indicating highly variable behavior. Some processes are nearly starved (near 0%) while others burn high CPU on lock spinning (>8000%). This wide distribution suggests lock thrashing.
3.2 CPU Time Series
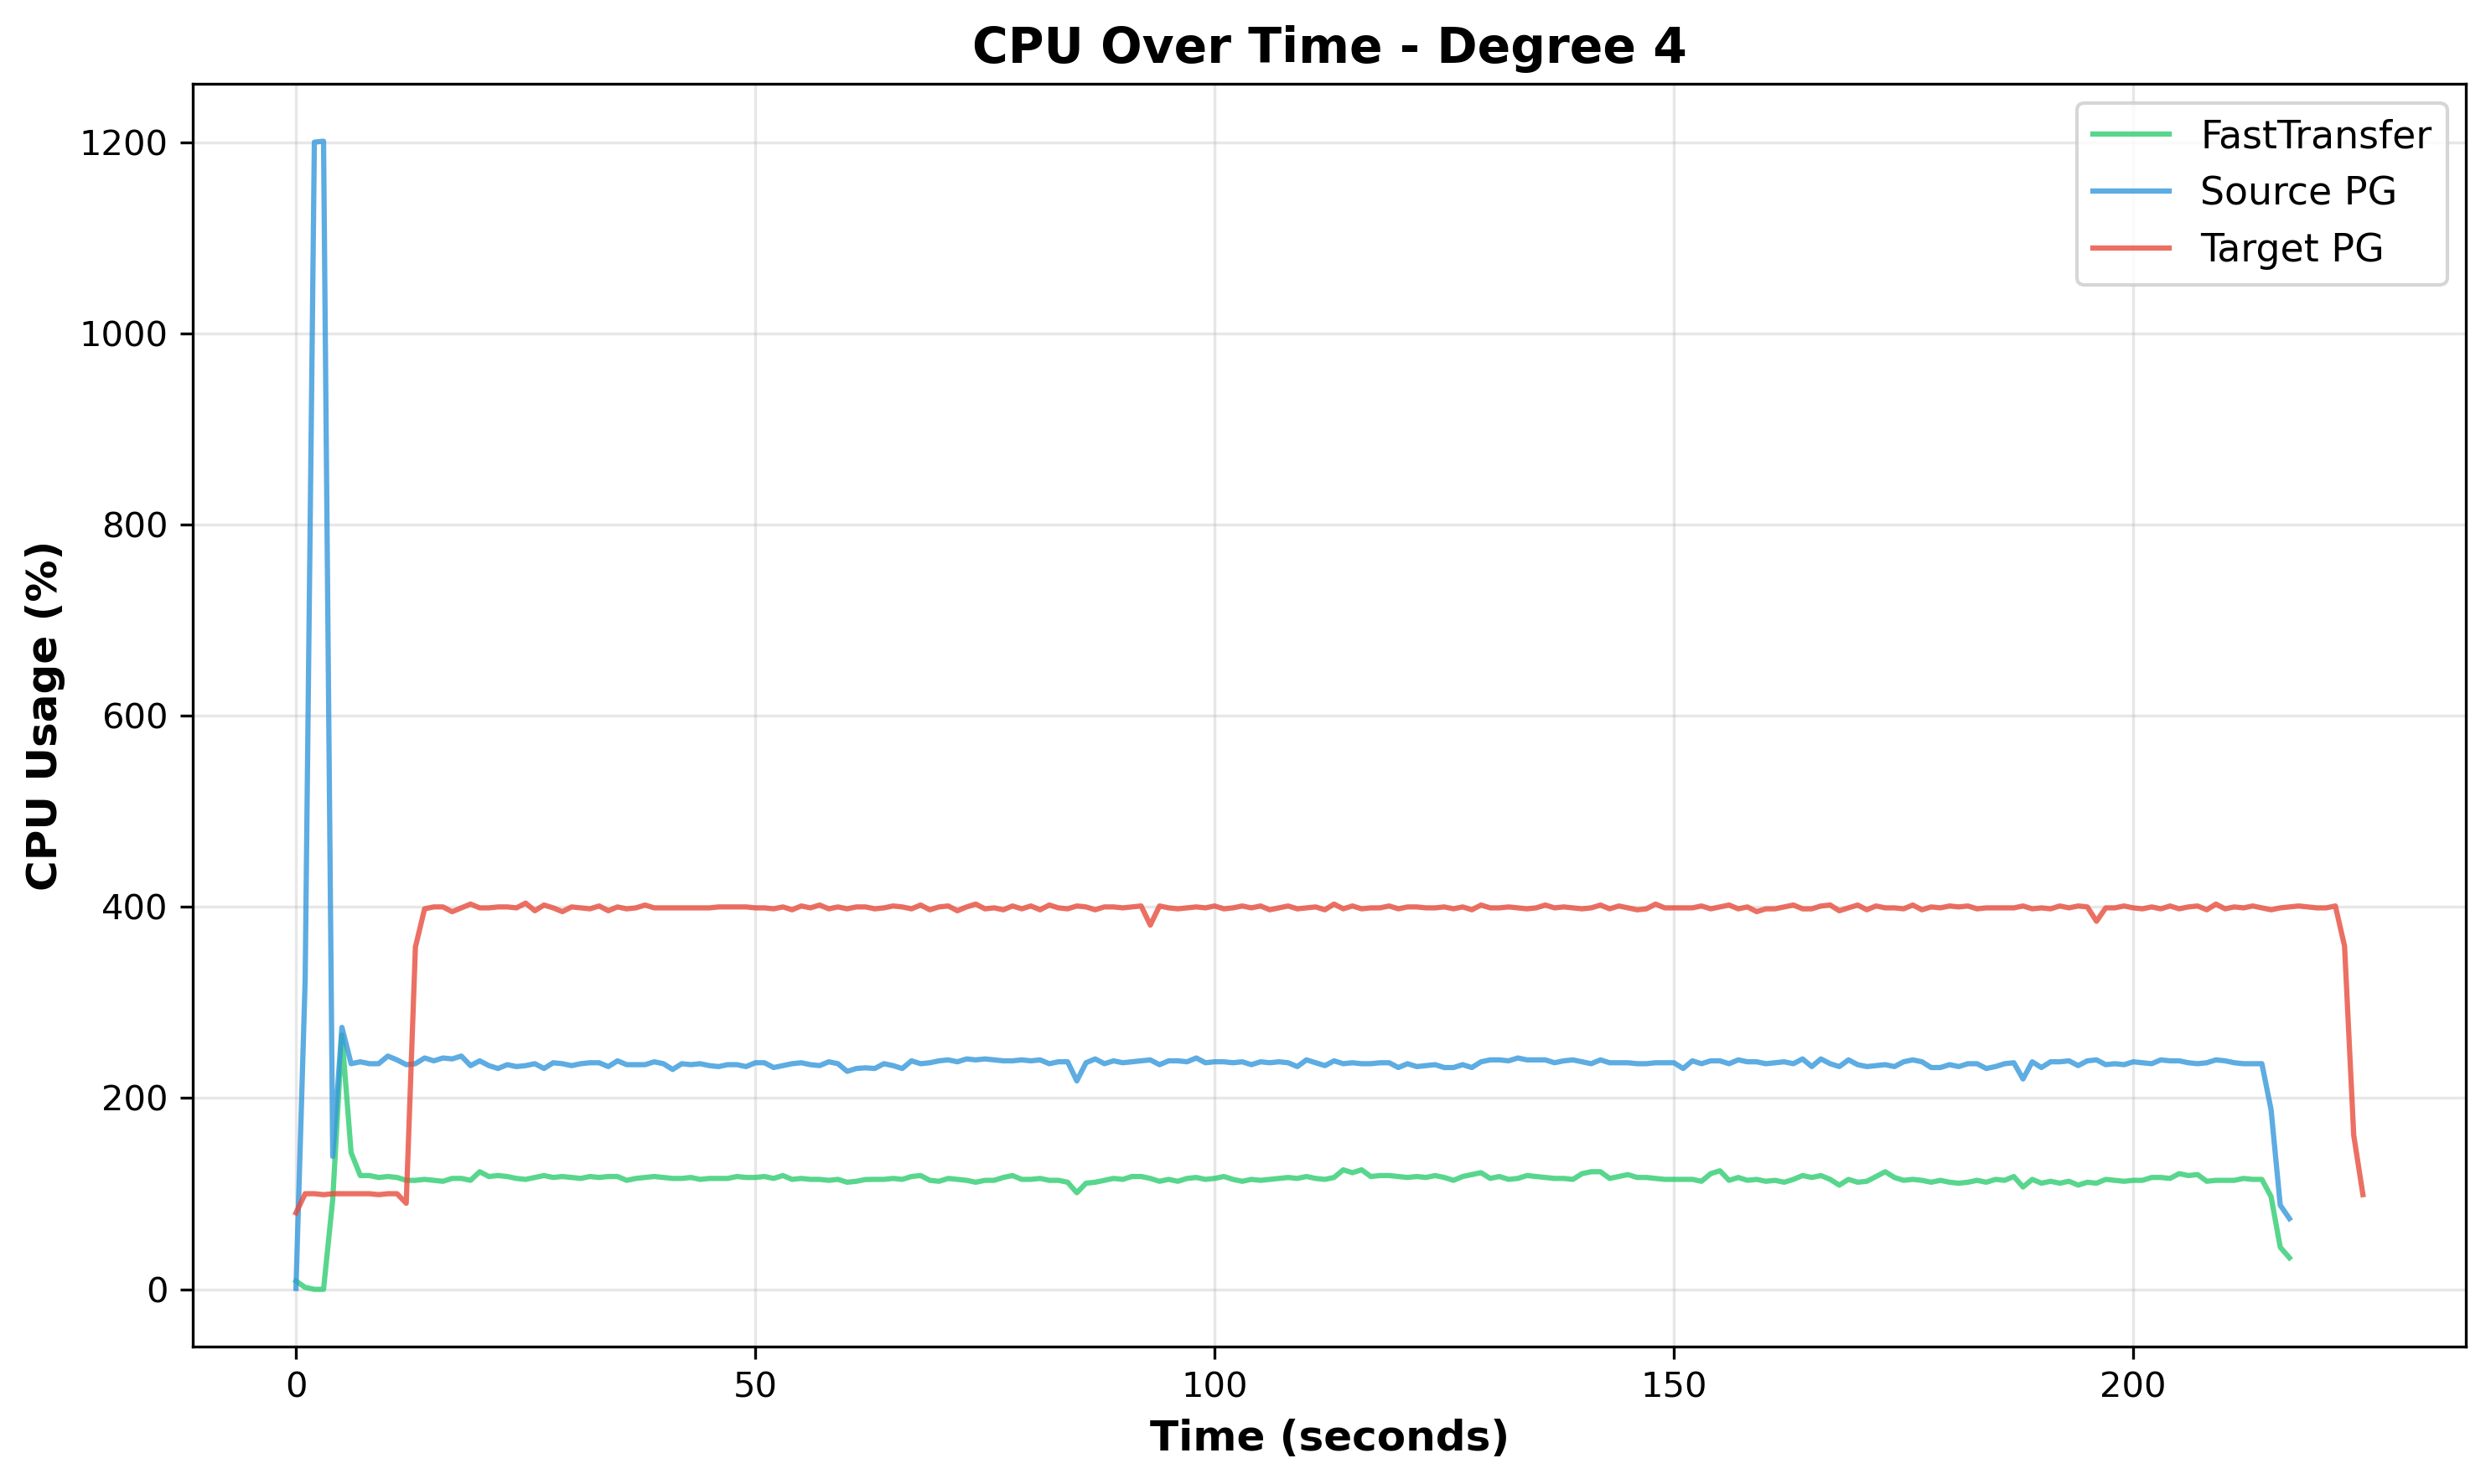
Figure 10: CPU Over Time at Degree 4 - All components show stable, smooth CPU usage with minimal oscillations throughout the test duration.
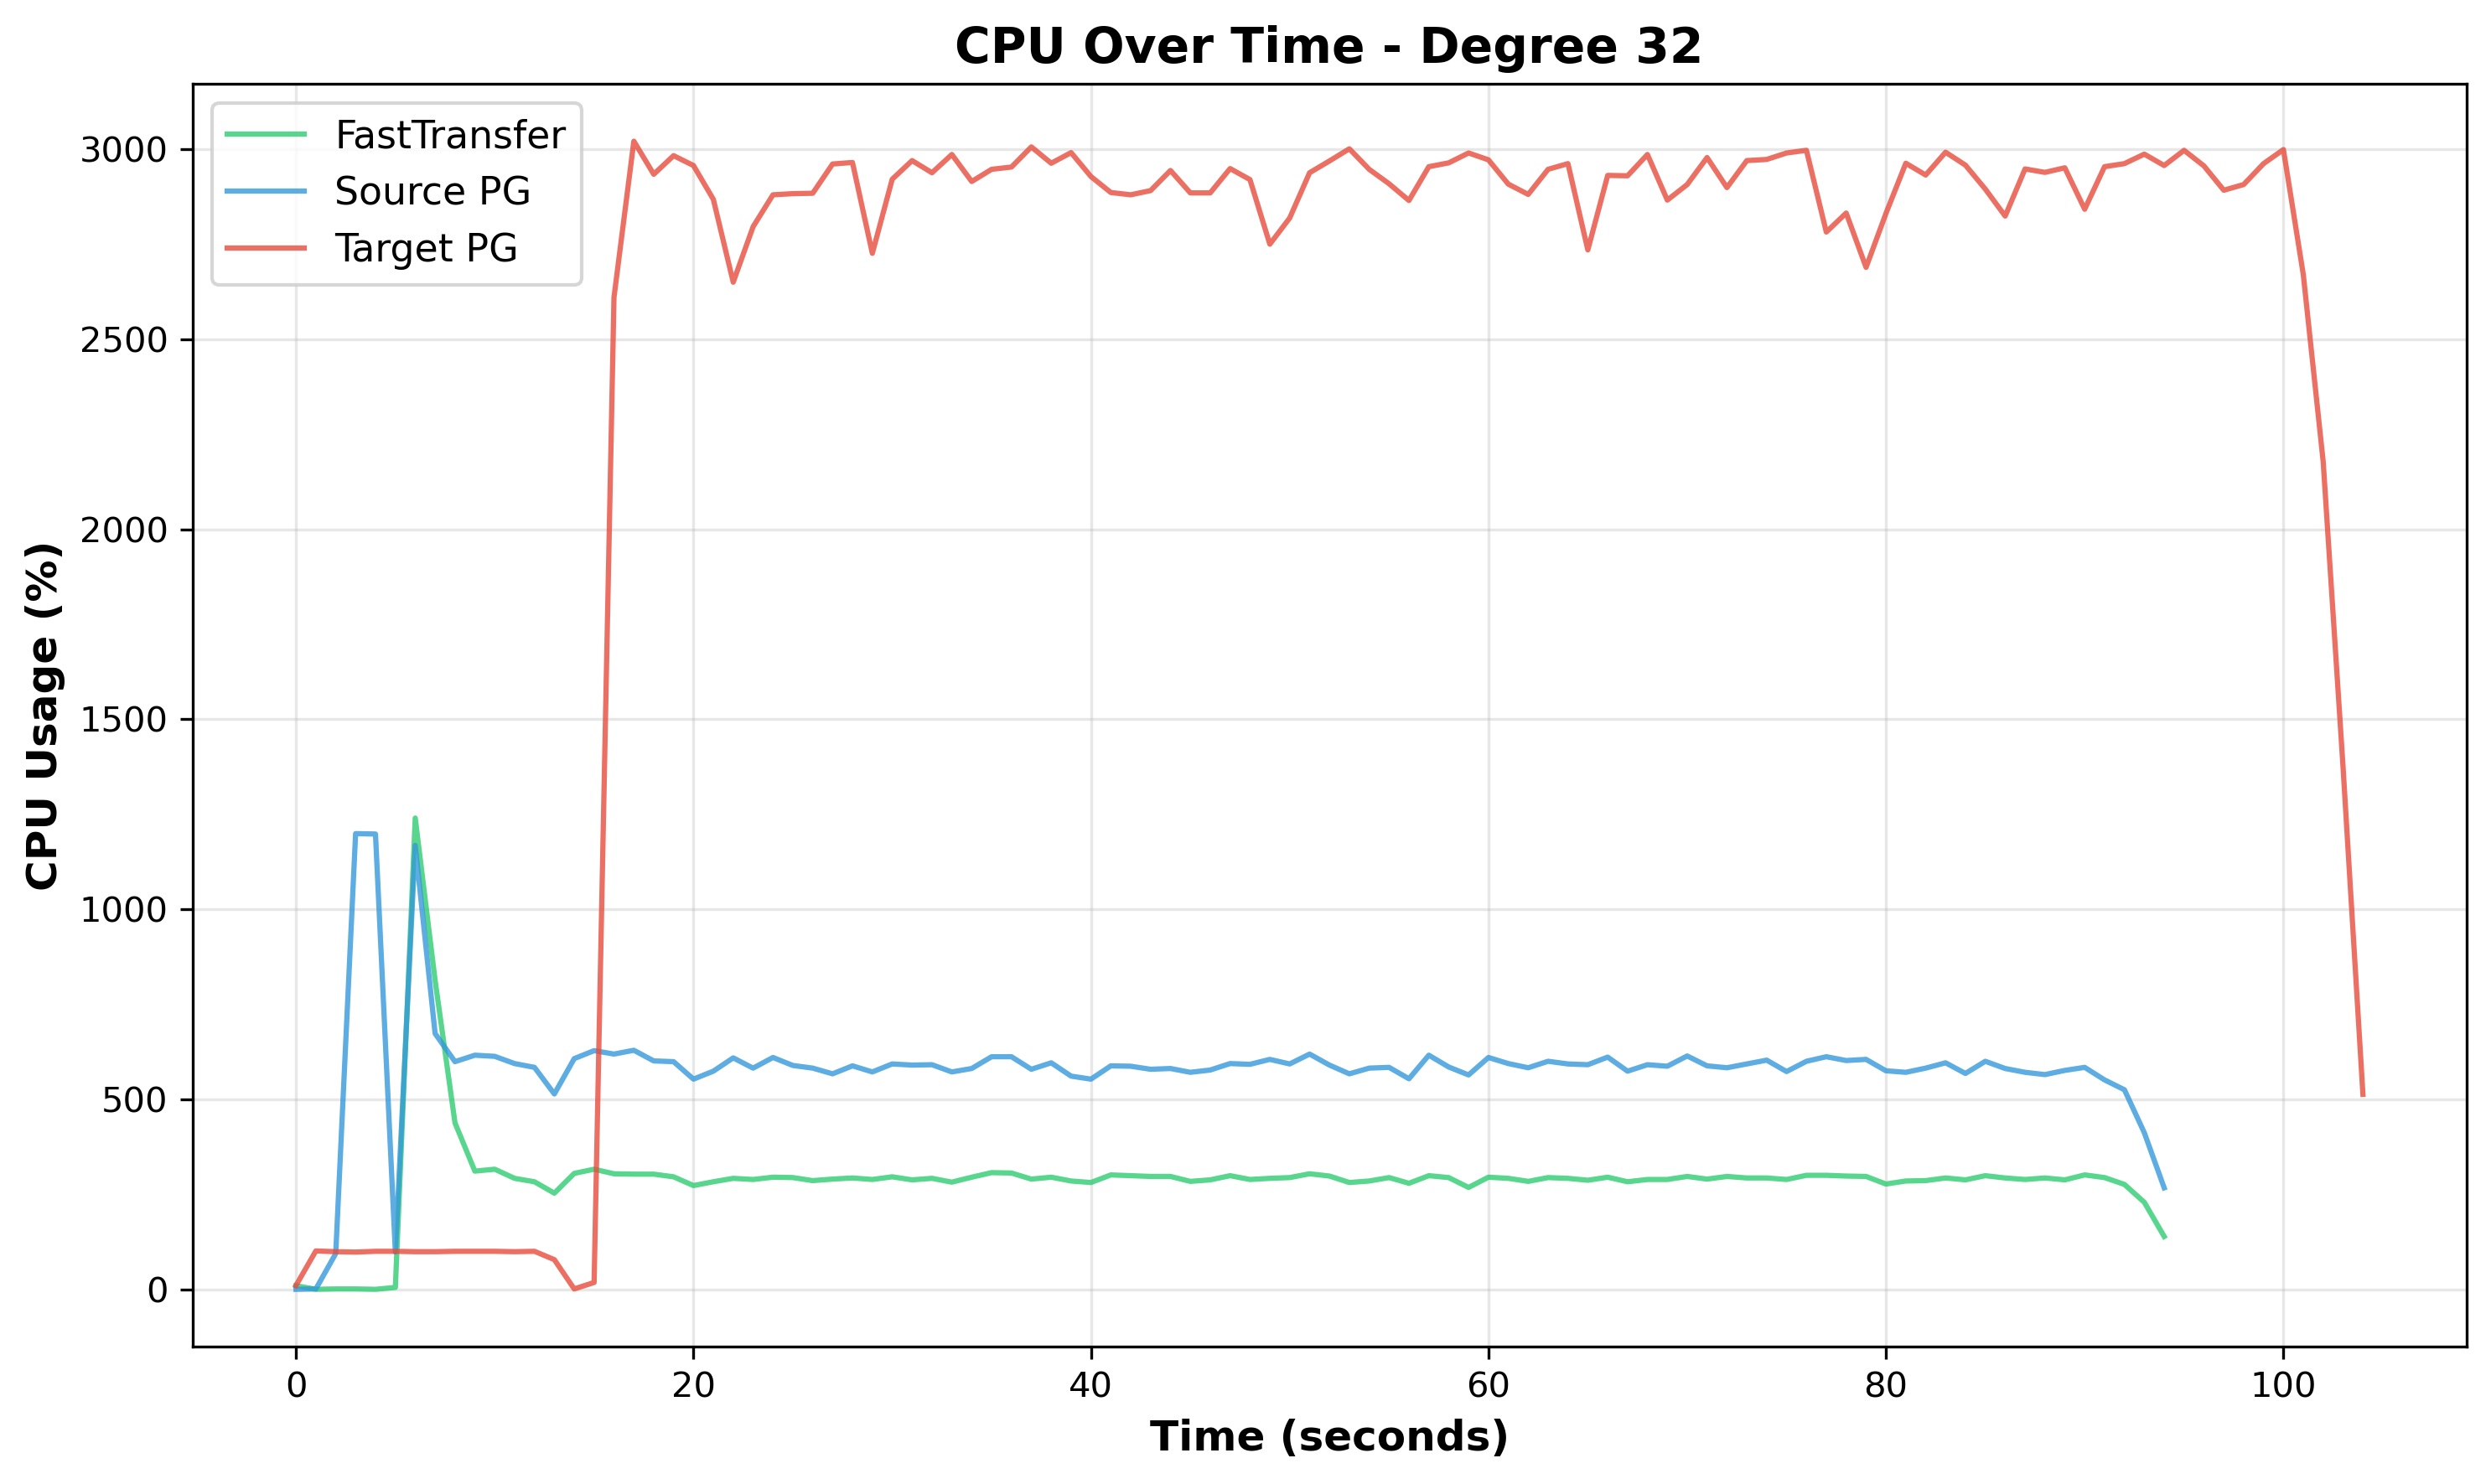
Figure 11: CPU Over Time at Degree 32 - Target PostgreSQL (red) shows increasing variability and oscillations, indicating periods of successful lock acquisition alternating with blocking periods.
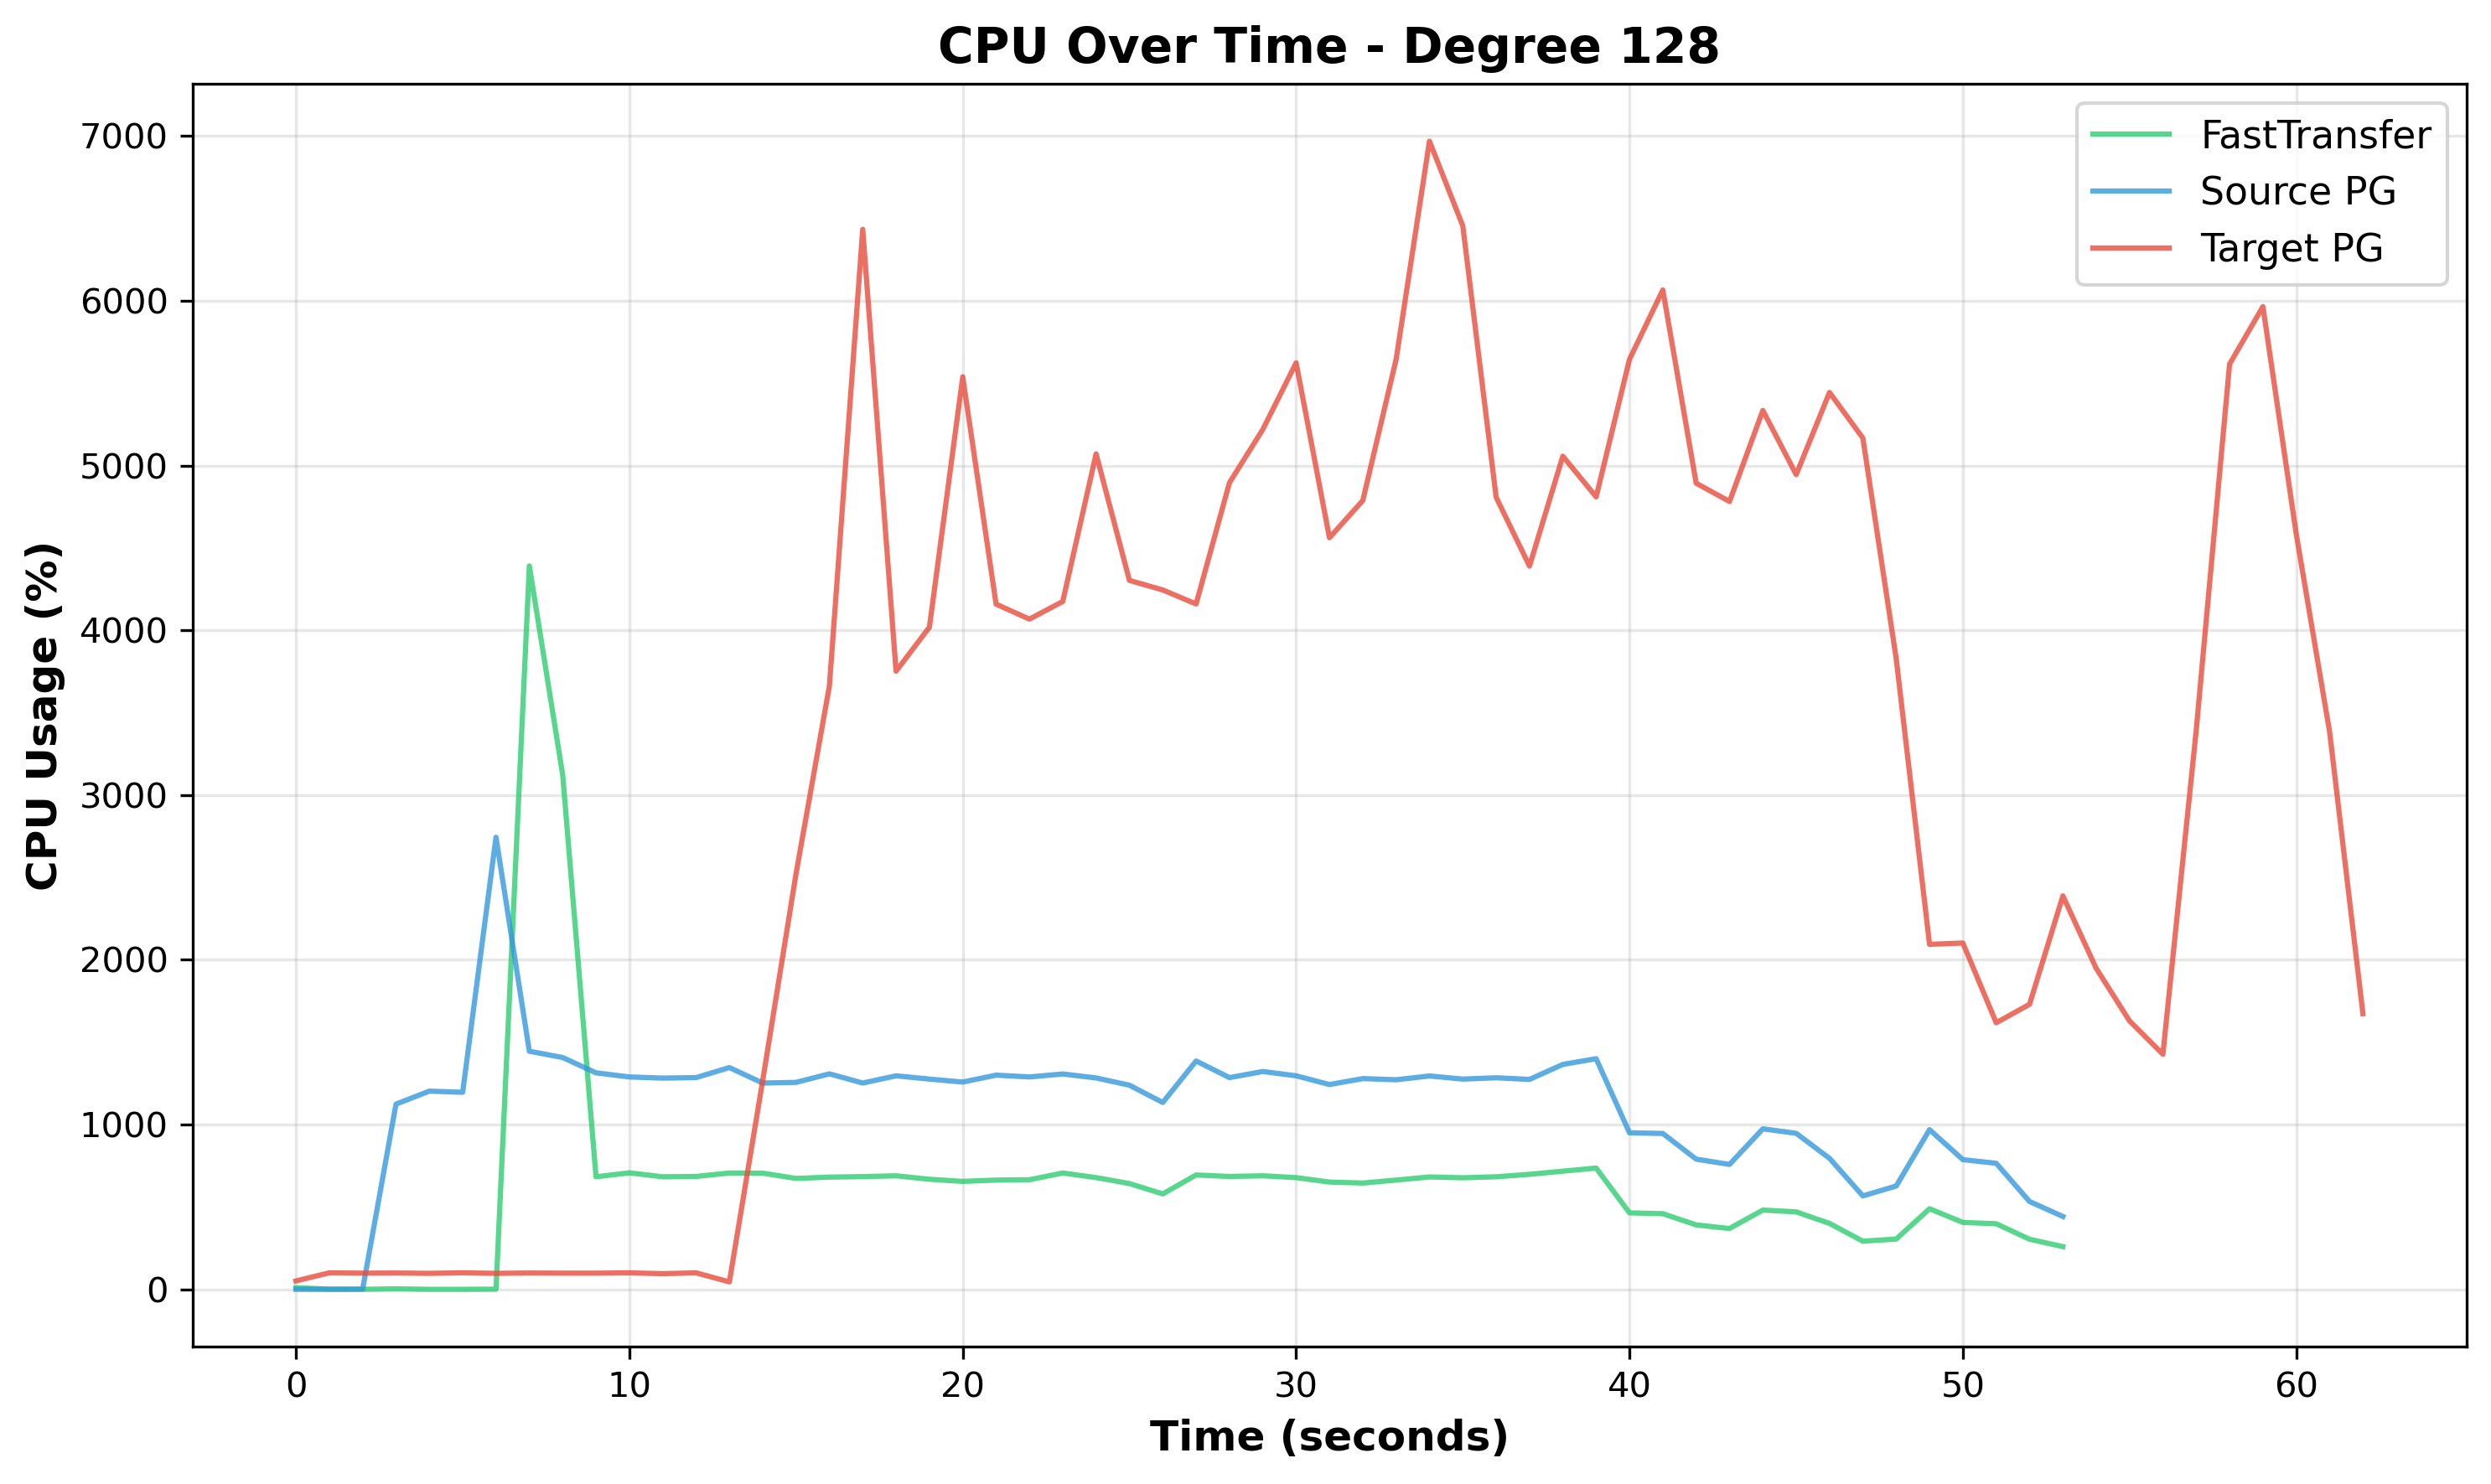
Figure 12: CPU Over Time at Degree 128 - Target PostgreSQL (red) exhibits oscillations with wild CPU swings, suggesting significant lock thrashing. Source (blue) and FastTransfer (green) show variability reflecting downstream backpressure.
4. Performance Scaling Analysis: Degrees 64 to 128
4.1 Continued Performance Improvement at Extreme Parallelism
Degree 128 achieves the best absolute performance in the test suite, completing the transfer in 67 seconds compared to 92 seconds at degree 64, a meaningful 1.37x speedup that brings total throughput to 1.15 GB/s. While this represents 68.7% efficiency for the doubling operation (rather than the theoretical 2x), the continued improvement demonstrates that the system remains functional and beneficial even at extreme parallelism levels.
4.2 Unexpected Efficiency Improvements at Degree 128
Degree 128 exhibits a counterintuitive result: lower system CPU overhead (70.5%) than degree 64 (83.9%) despite doubling parallelism, while total CPU actually decreases by 8.0% (4,596% → 4,230%). User CPU efficiency improves by 82.1% (16.2% → 29.5% of total CPU), meaning nearly double the proportion of CPU time goes to productive work rather than lock contention. The reason for these improvements remains unclear.
The Comparative Analysis:
| Metric | Degree 64 | Degree 128 | Change |
|---|---|---|---|
| Elapsed Time | 92s | 67s | 1.37x speedup |
| Total CPU | 4,596% | 4,230% | -8.0% |
| User CPU | 743% (16.2% of total) | 1,248% (29.5% of total) | +68.0% |
| System CPU | 3,854% (83.9% of total) | 2,982% (70.5% of total) | -22.6% |
| Network Throughput | 1,033 MB/s mean | 1,088 MB/s mean | +5.3% |
| Network Peak | 2,335 MB/s (93.4%) | 2,904 MB/s (116.2%) | Saturation |
| Disk Throughput | 759 MB/s | 1,099 MB/s | +44.8% |
Open Question: Why Does Efficiency Improve at Degree 128?
The improvement from degree 64 to 128 is puzzling for several reasons:
-
Why does network bandwidth increase by 5.3% (1,033 MB/s → 1,088 MB/s) when adding more parallelism to an already saturated network? At degree 128, network peaks at 2,904 MB/s (116.2% of capacity), yet mean throughput still increases.
-
Why does system CPU overhead decrease from 83.9% to 70.5% despite doubling parallelism? More processes should create more lock contention, not less.
-
Why does user CPU efficiency nearly double (16.2% → 29.5% of total) when adding 64 more processes competing for the same resources?
One hypothesis is that network saturation at degree 128 acts as a pacing mechanism, rate-limiting data delivery and preventing all 128 processes from simultaneously contending for locks. However, this doesn’t fully explain why network throughput itself increases, nor why the efficiency gains are so substantial. The interaction between network saturation, lock contention, and process scheduling appears more complex than initially understood.
5. Disk I/O and Network Analysis
5.1 Source Disk I/O Analysis
The source instance has 256GB RAM with a Postgres effective_cache_size of 192GB, and the lineitem table is ~77GB. An important detail explains the disk behavior across test runs:
Degree 1 was the first test run with no prior warm-up or cold run to pre-load the table into cache. During this first run at degree 1, there is a heavy disk activity (500 MB/s, ~50% peak utilization) where the table is loaded into memory (shared_buffers + OS page cache). At degrees 2-128, there is essentially zero disk activity; the entire table remains cached in memory from the initial degree 1 load. This explains why degree 2 is more than twice as fast as degree 1: the degree 1 run includes the initial table-loading overhead, while degree 2 benefits from the already-cached table with no disk loading required. The speedup from degree 1 to 2 reflects both the doubling of parallelism and the elimination of the initial cache-loading penalty.
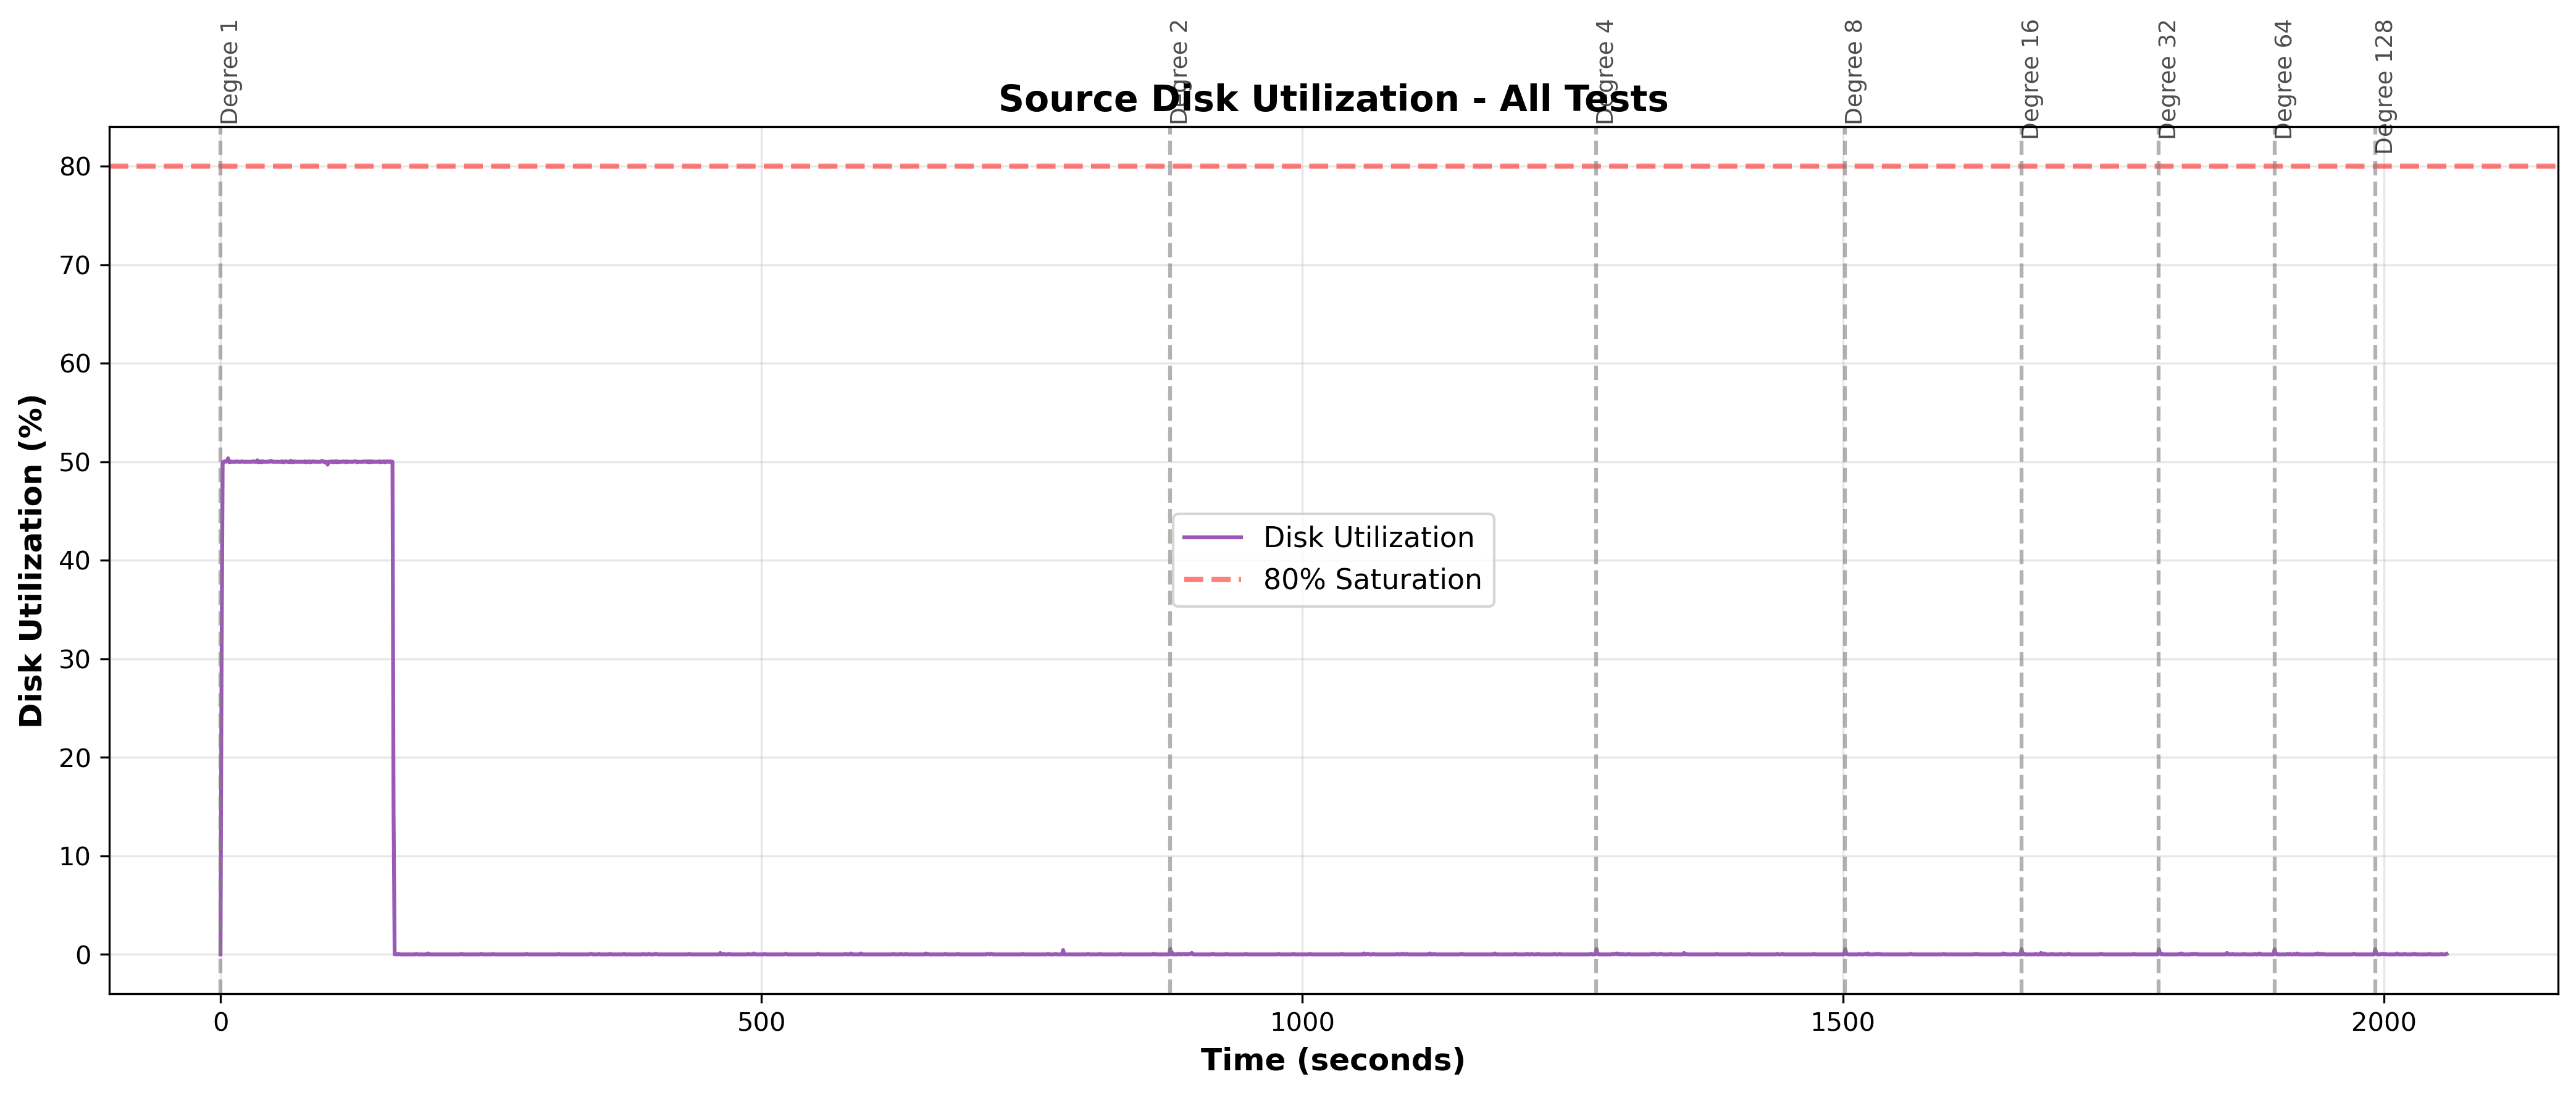
Figure 13: Source Disk Utilization Over Time - Shows disk utilization across all test runs (vertical lines mark test boundaries for degrees 1, 2, 4, 8, 16, 32, 64, 128). At degree 1, utilization peaks at ~50% during the initial table load, then drops to near-zero. At higher degrees (2-128), utilization remains below 1% throughout, confirming the disk is idle and not limiting performance.
Disk utilization measures the percentage of time the disk is busy serving I/O requests. Source disk I/O is not a bottleneck at any parallelism degree.
5.2 Target Disk I/O Time Series
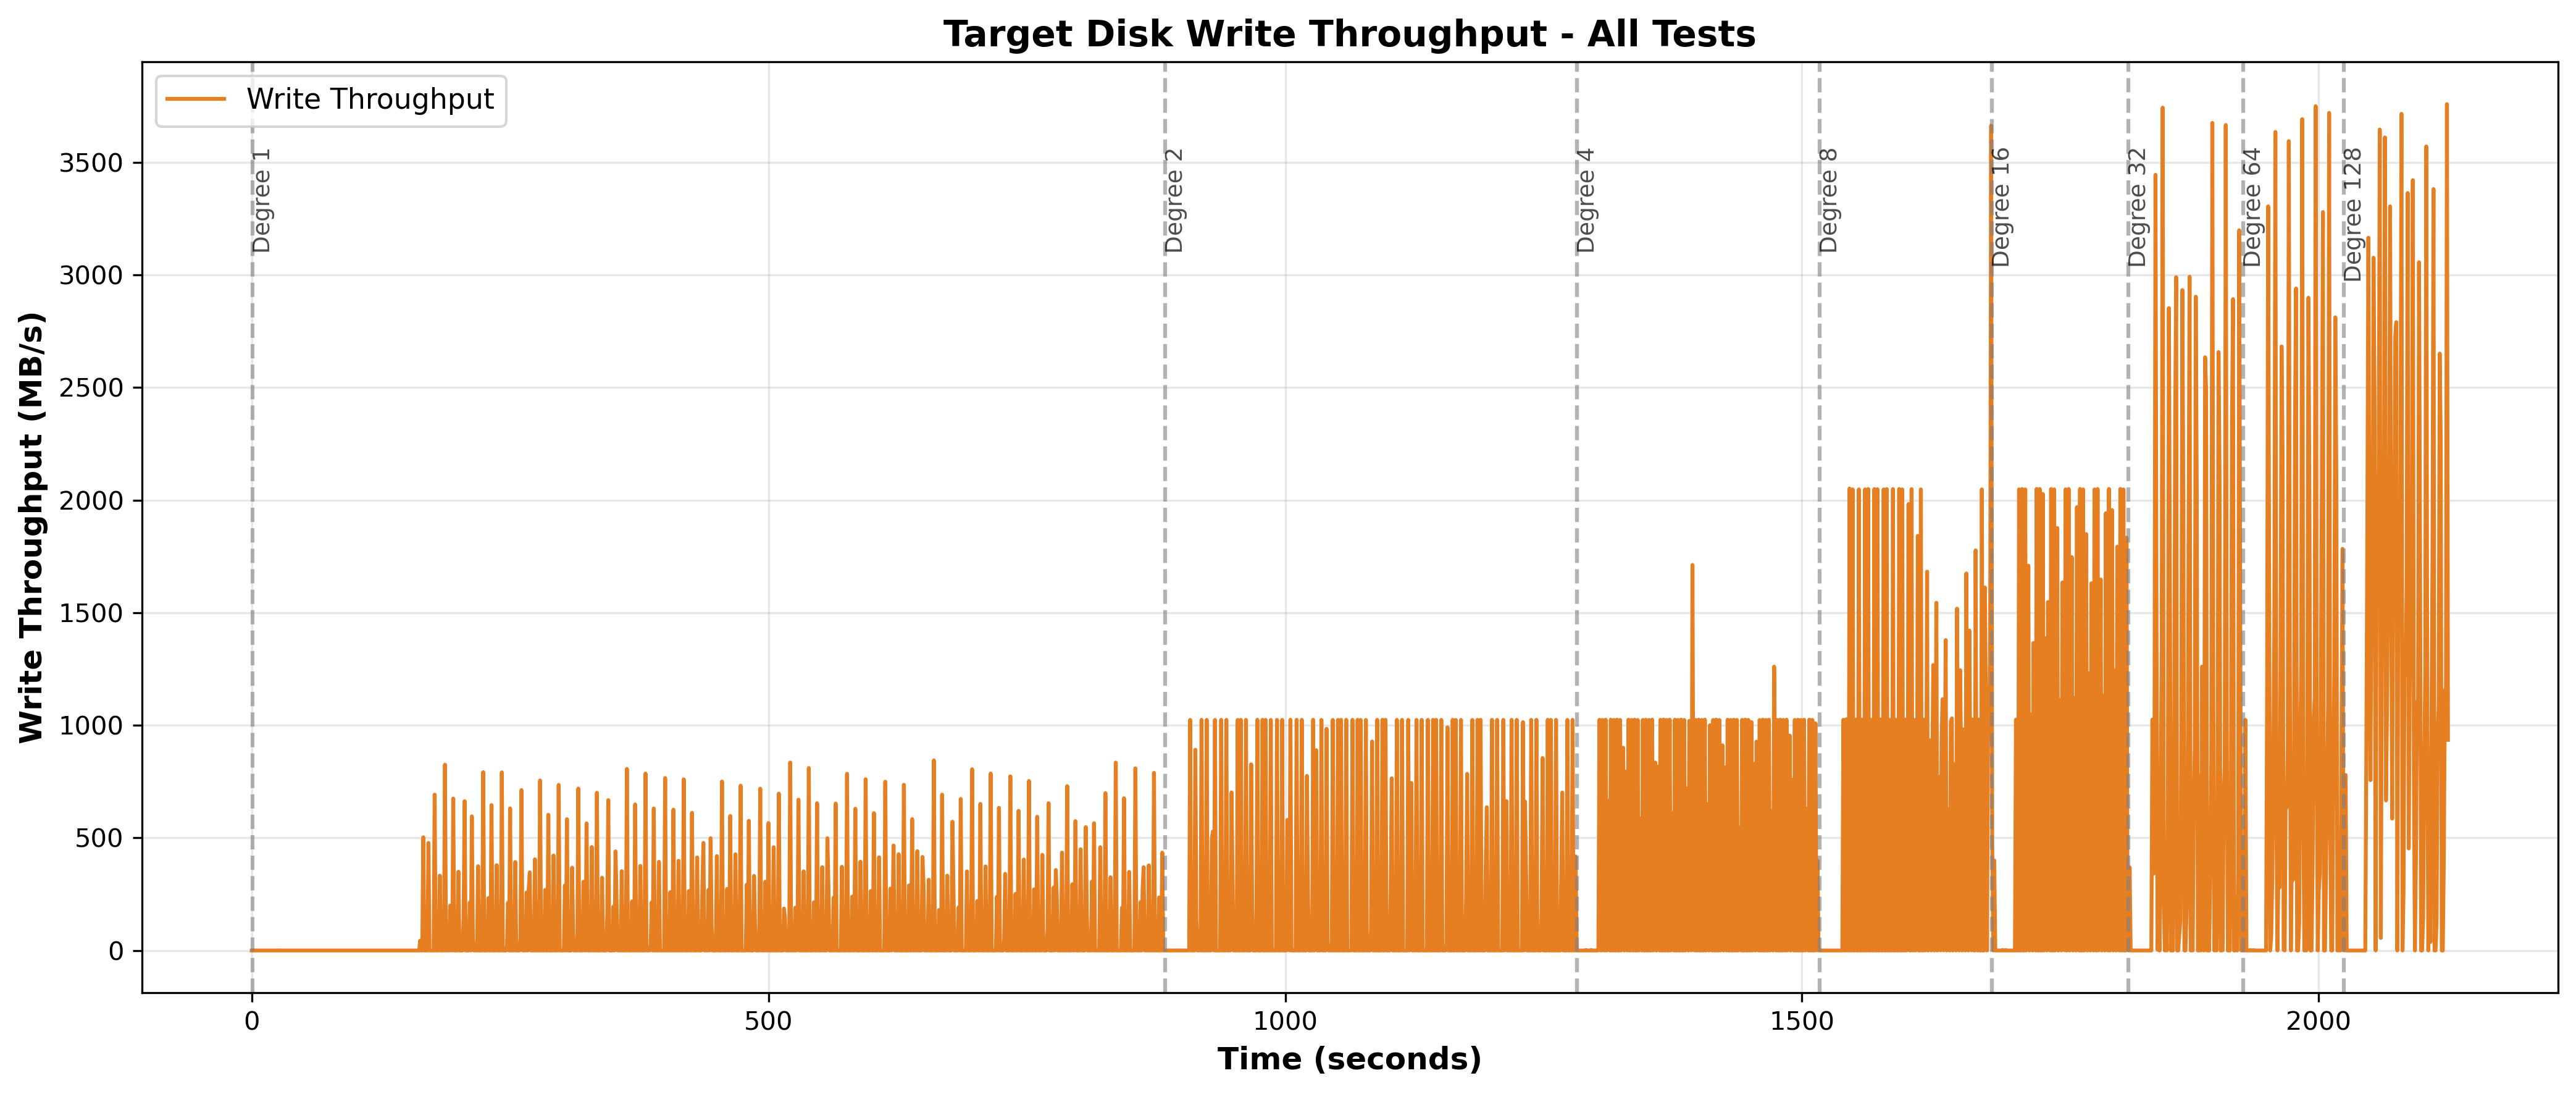
Figure 14: Target Disk Write Throughput Over Time - Throughput exhibits bursty behavior with spikes to 2000-3759 MB/s followed by drops to near zero. Sustained baseline varies from ~100 MB/s (low degrees) to ~300 MB/s (degree 128) but never sustains disk capacity.
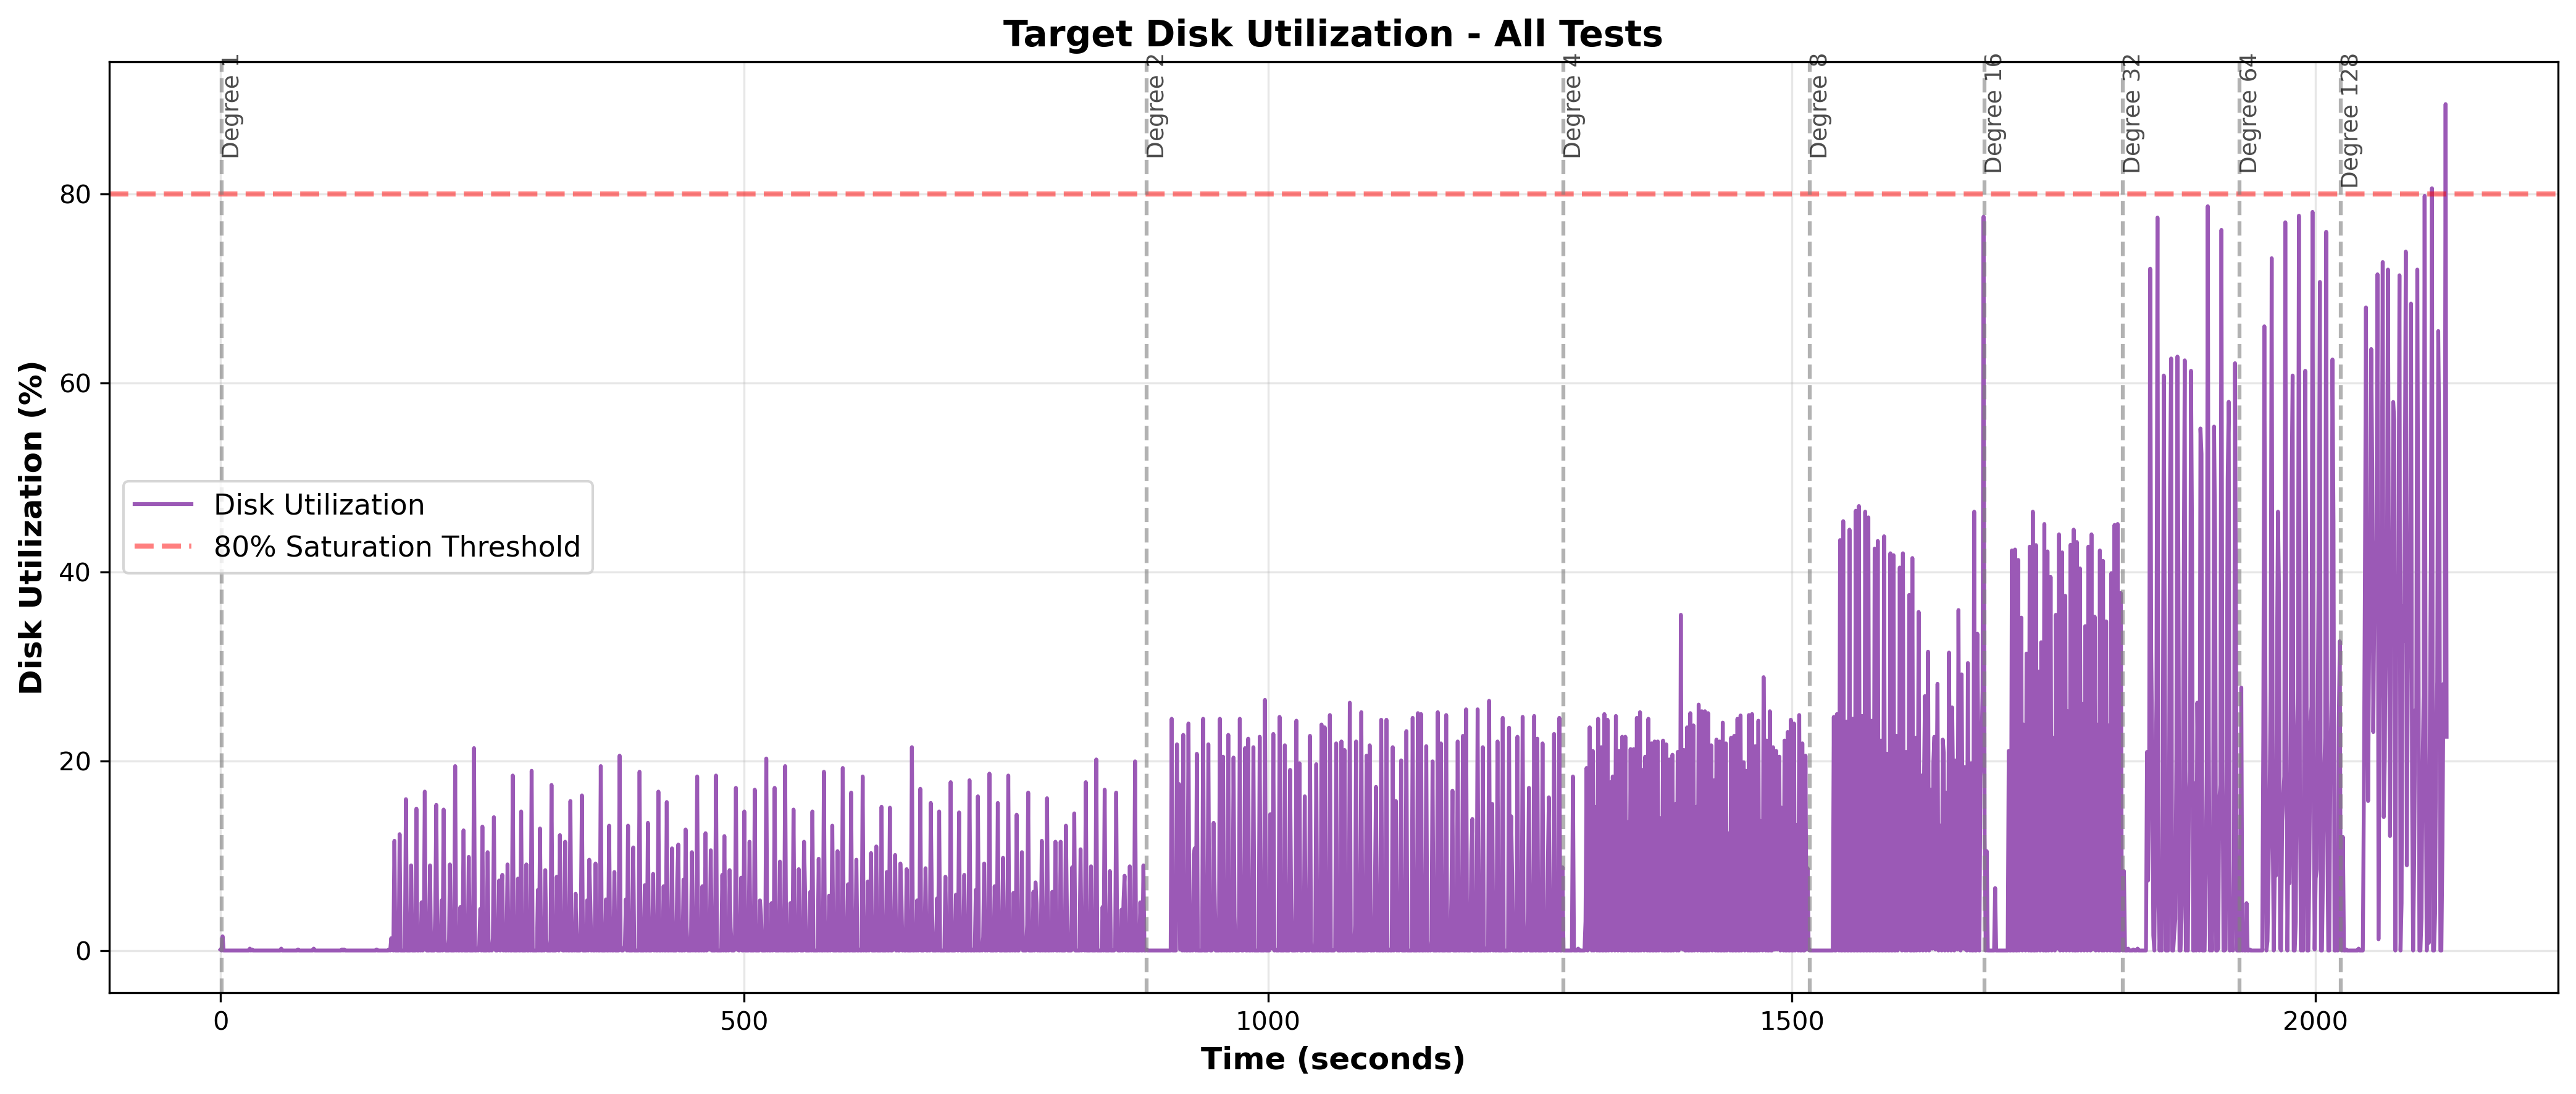
Figure 15: Target Disk Utilization Over Time - Mean utilization remains below 25% across all degrees. Spikes reach 70-90% during bursts but quickly return to low baseline. This suggests disk I/O is not the bottleneck.
5.3 Network Throughput Analysis
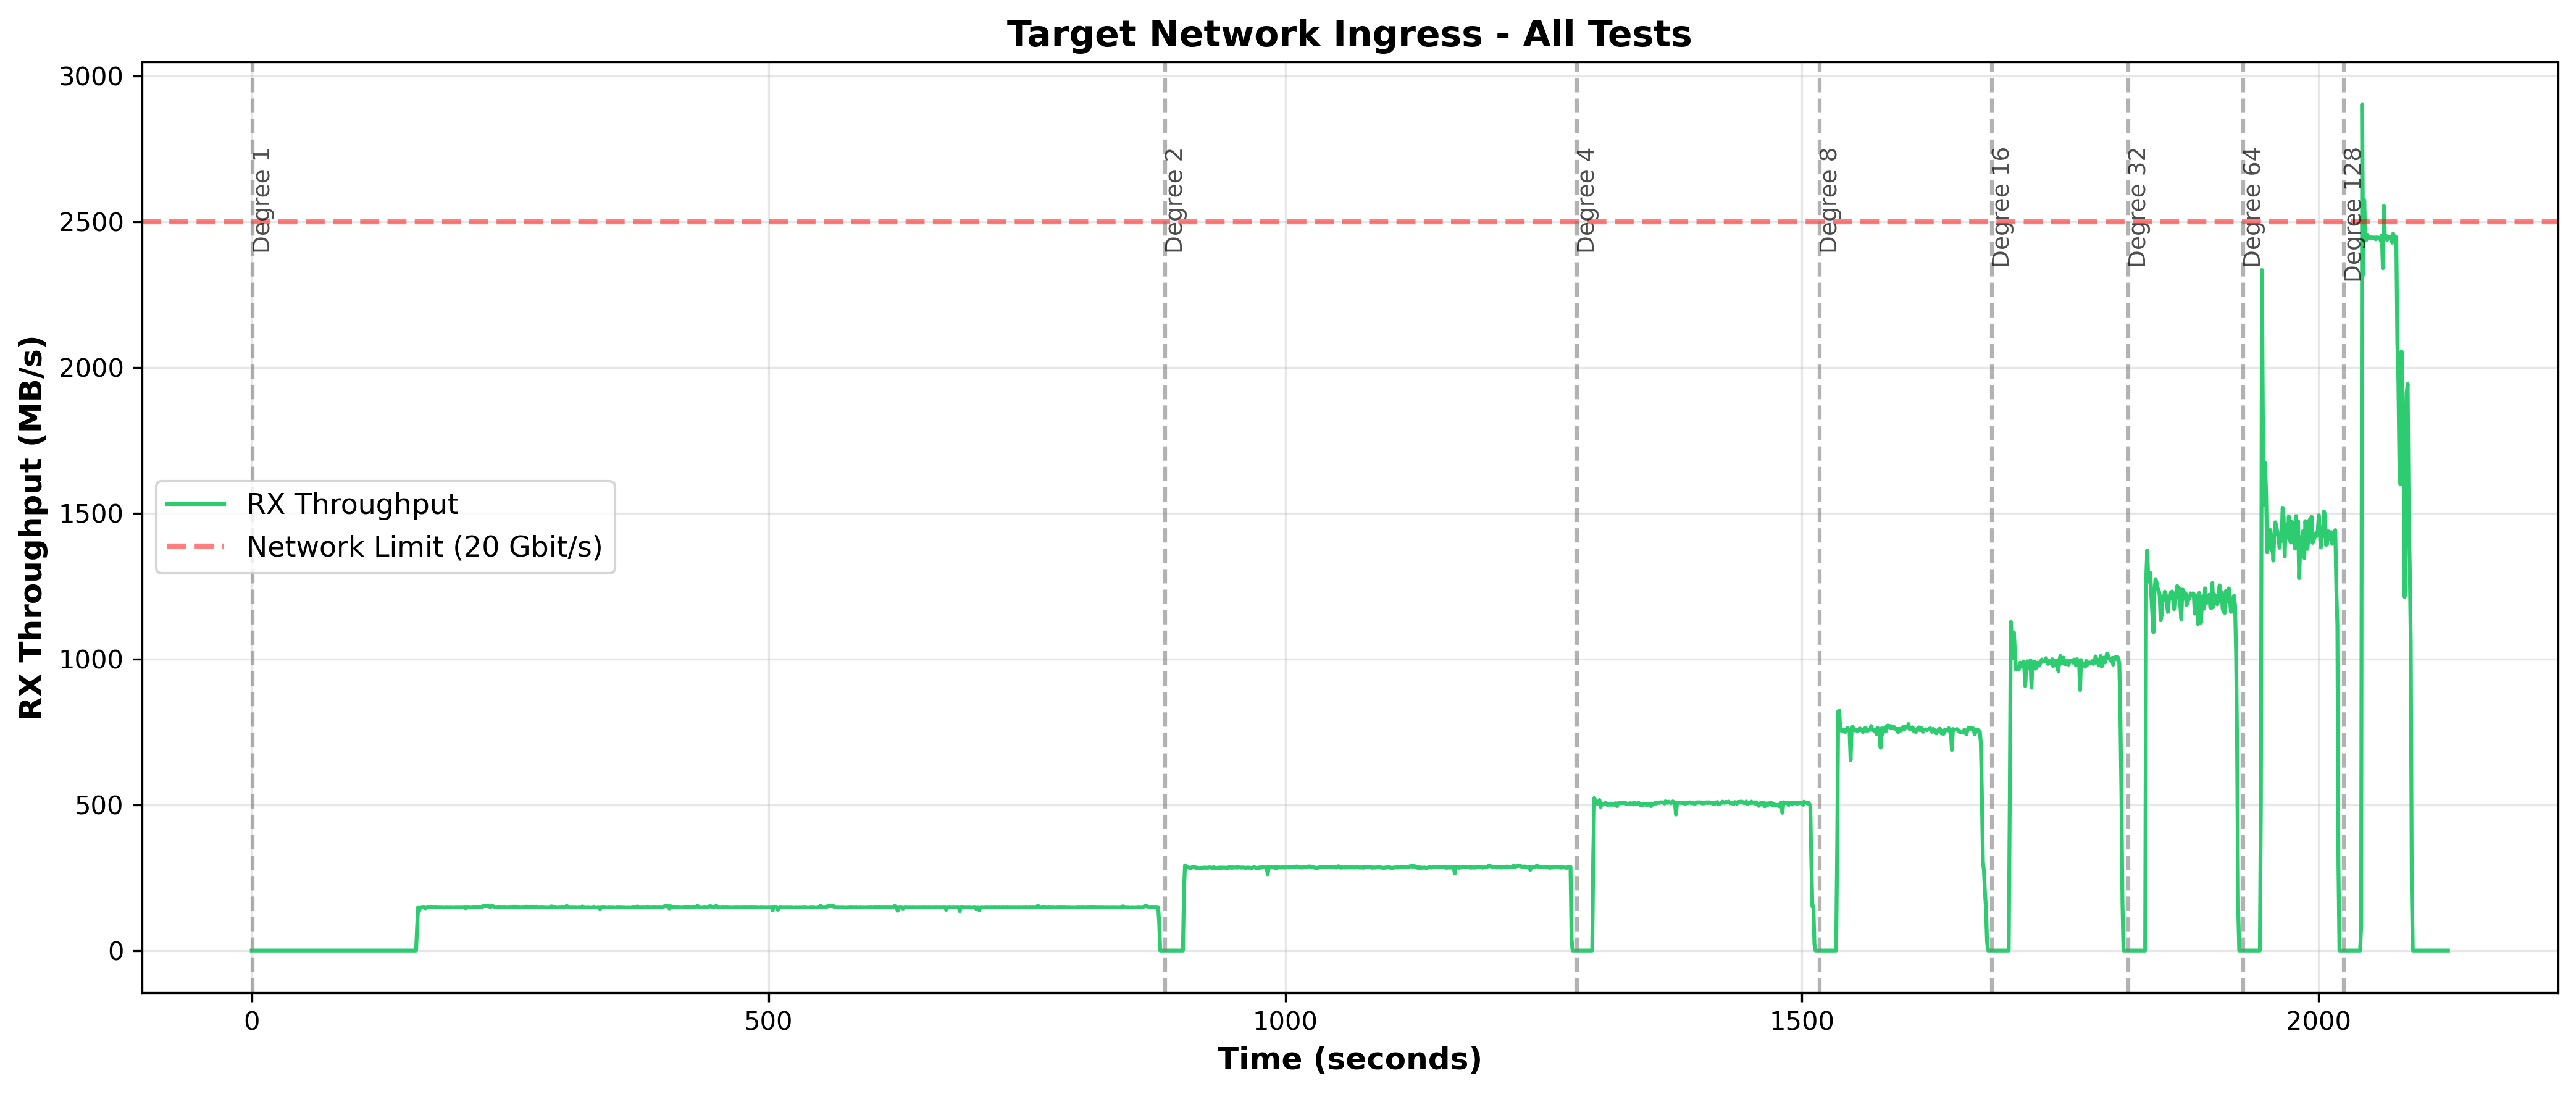
Figure 16: Target Network Ingress Over Time - At degree 128, throughput plateaus at ~2,450 MB/s (98% of capacity) during active bursts, but averages only 1,088 MB/s (43.5%) due to alternating active/idle periods. At degrees 1-64, network remains well below capacity.
Network saturation only occurs at degree 128 during active bursts. Therefore, network doesn’t explain poor scaling from degree 1 through 64, target CPU lock contention remains the primary bottleneck.
5.4 Cross-Degree Scaling Analysis
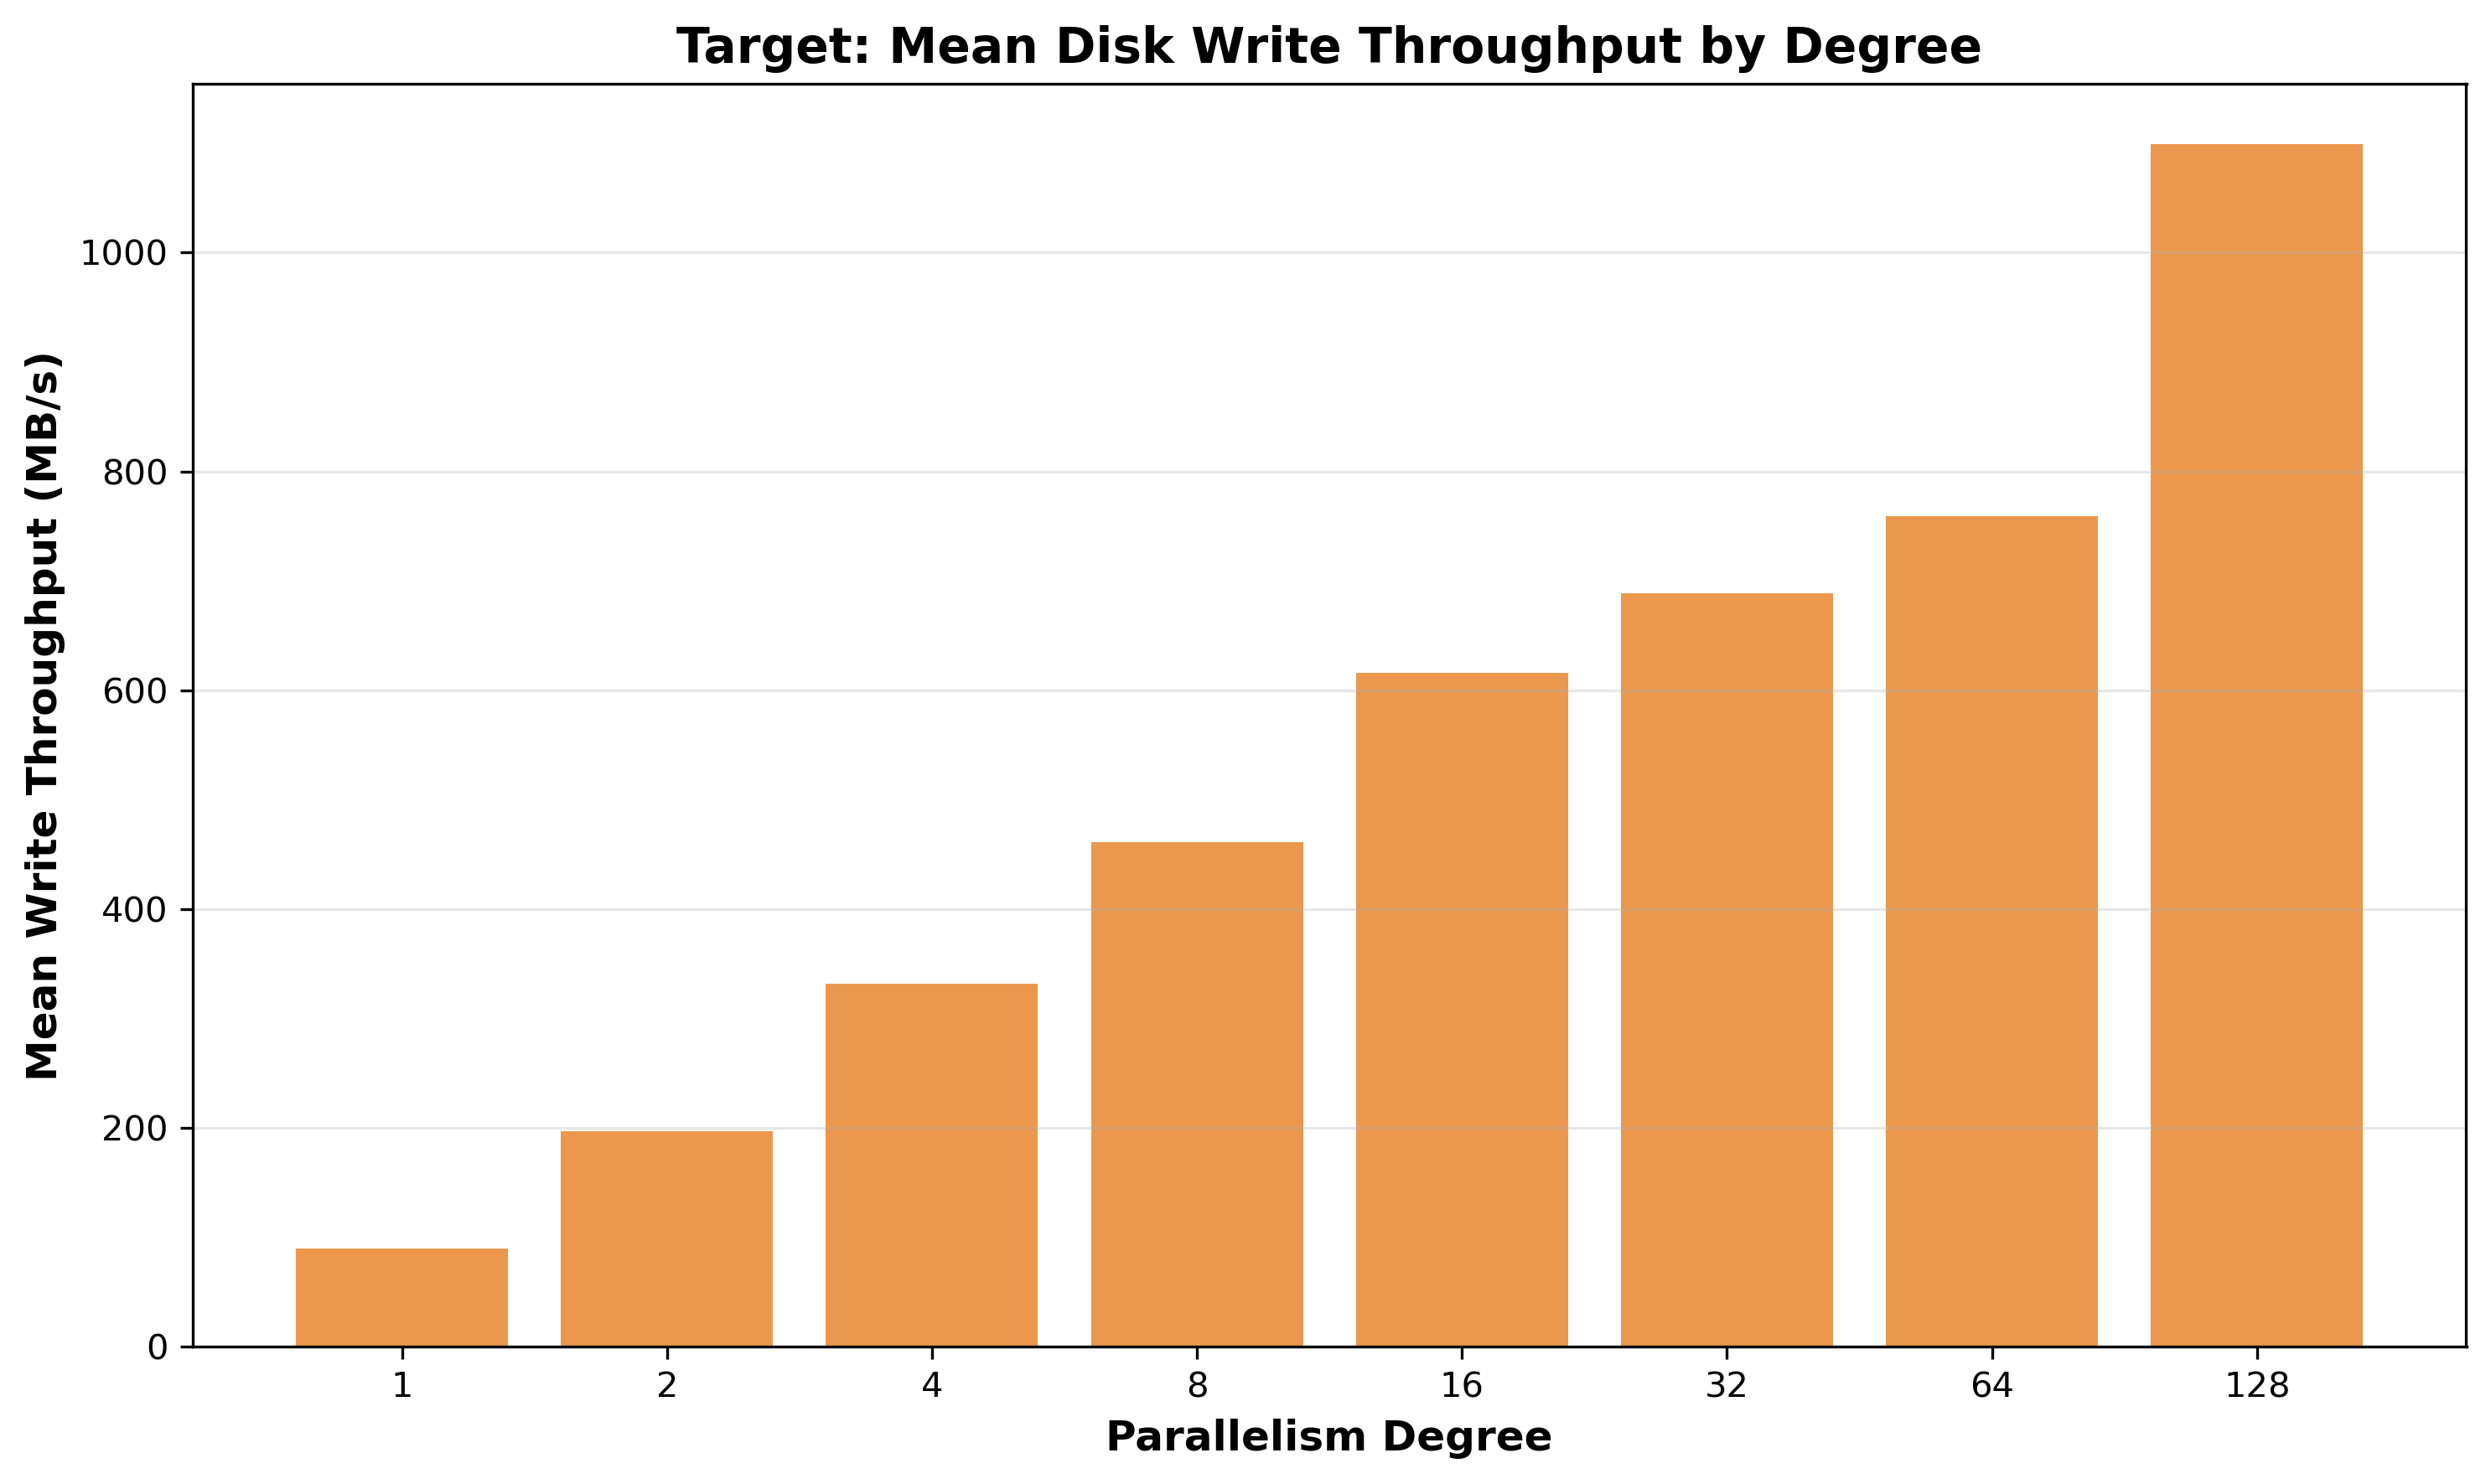
Figure 17: Mean Disk Write Throughput by Degree - Scales from 90 MB/s (degree 1) to 1,099 MB/s (degree 128), only 12.3x improvement for 128x parallelism (9.6% efficiency).
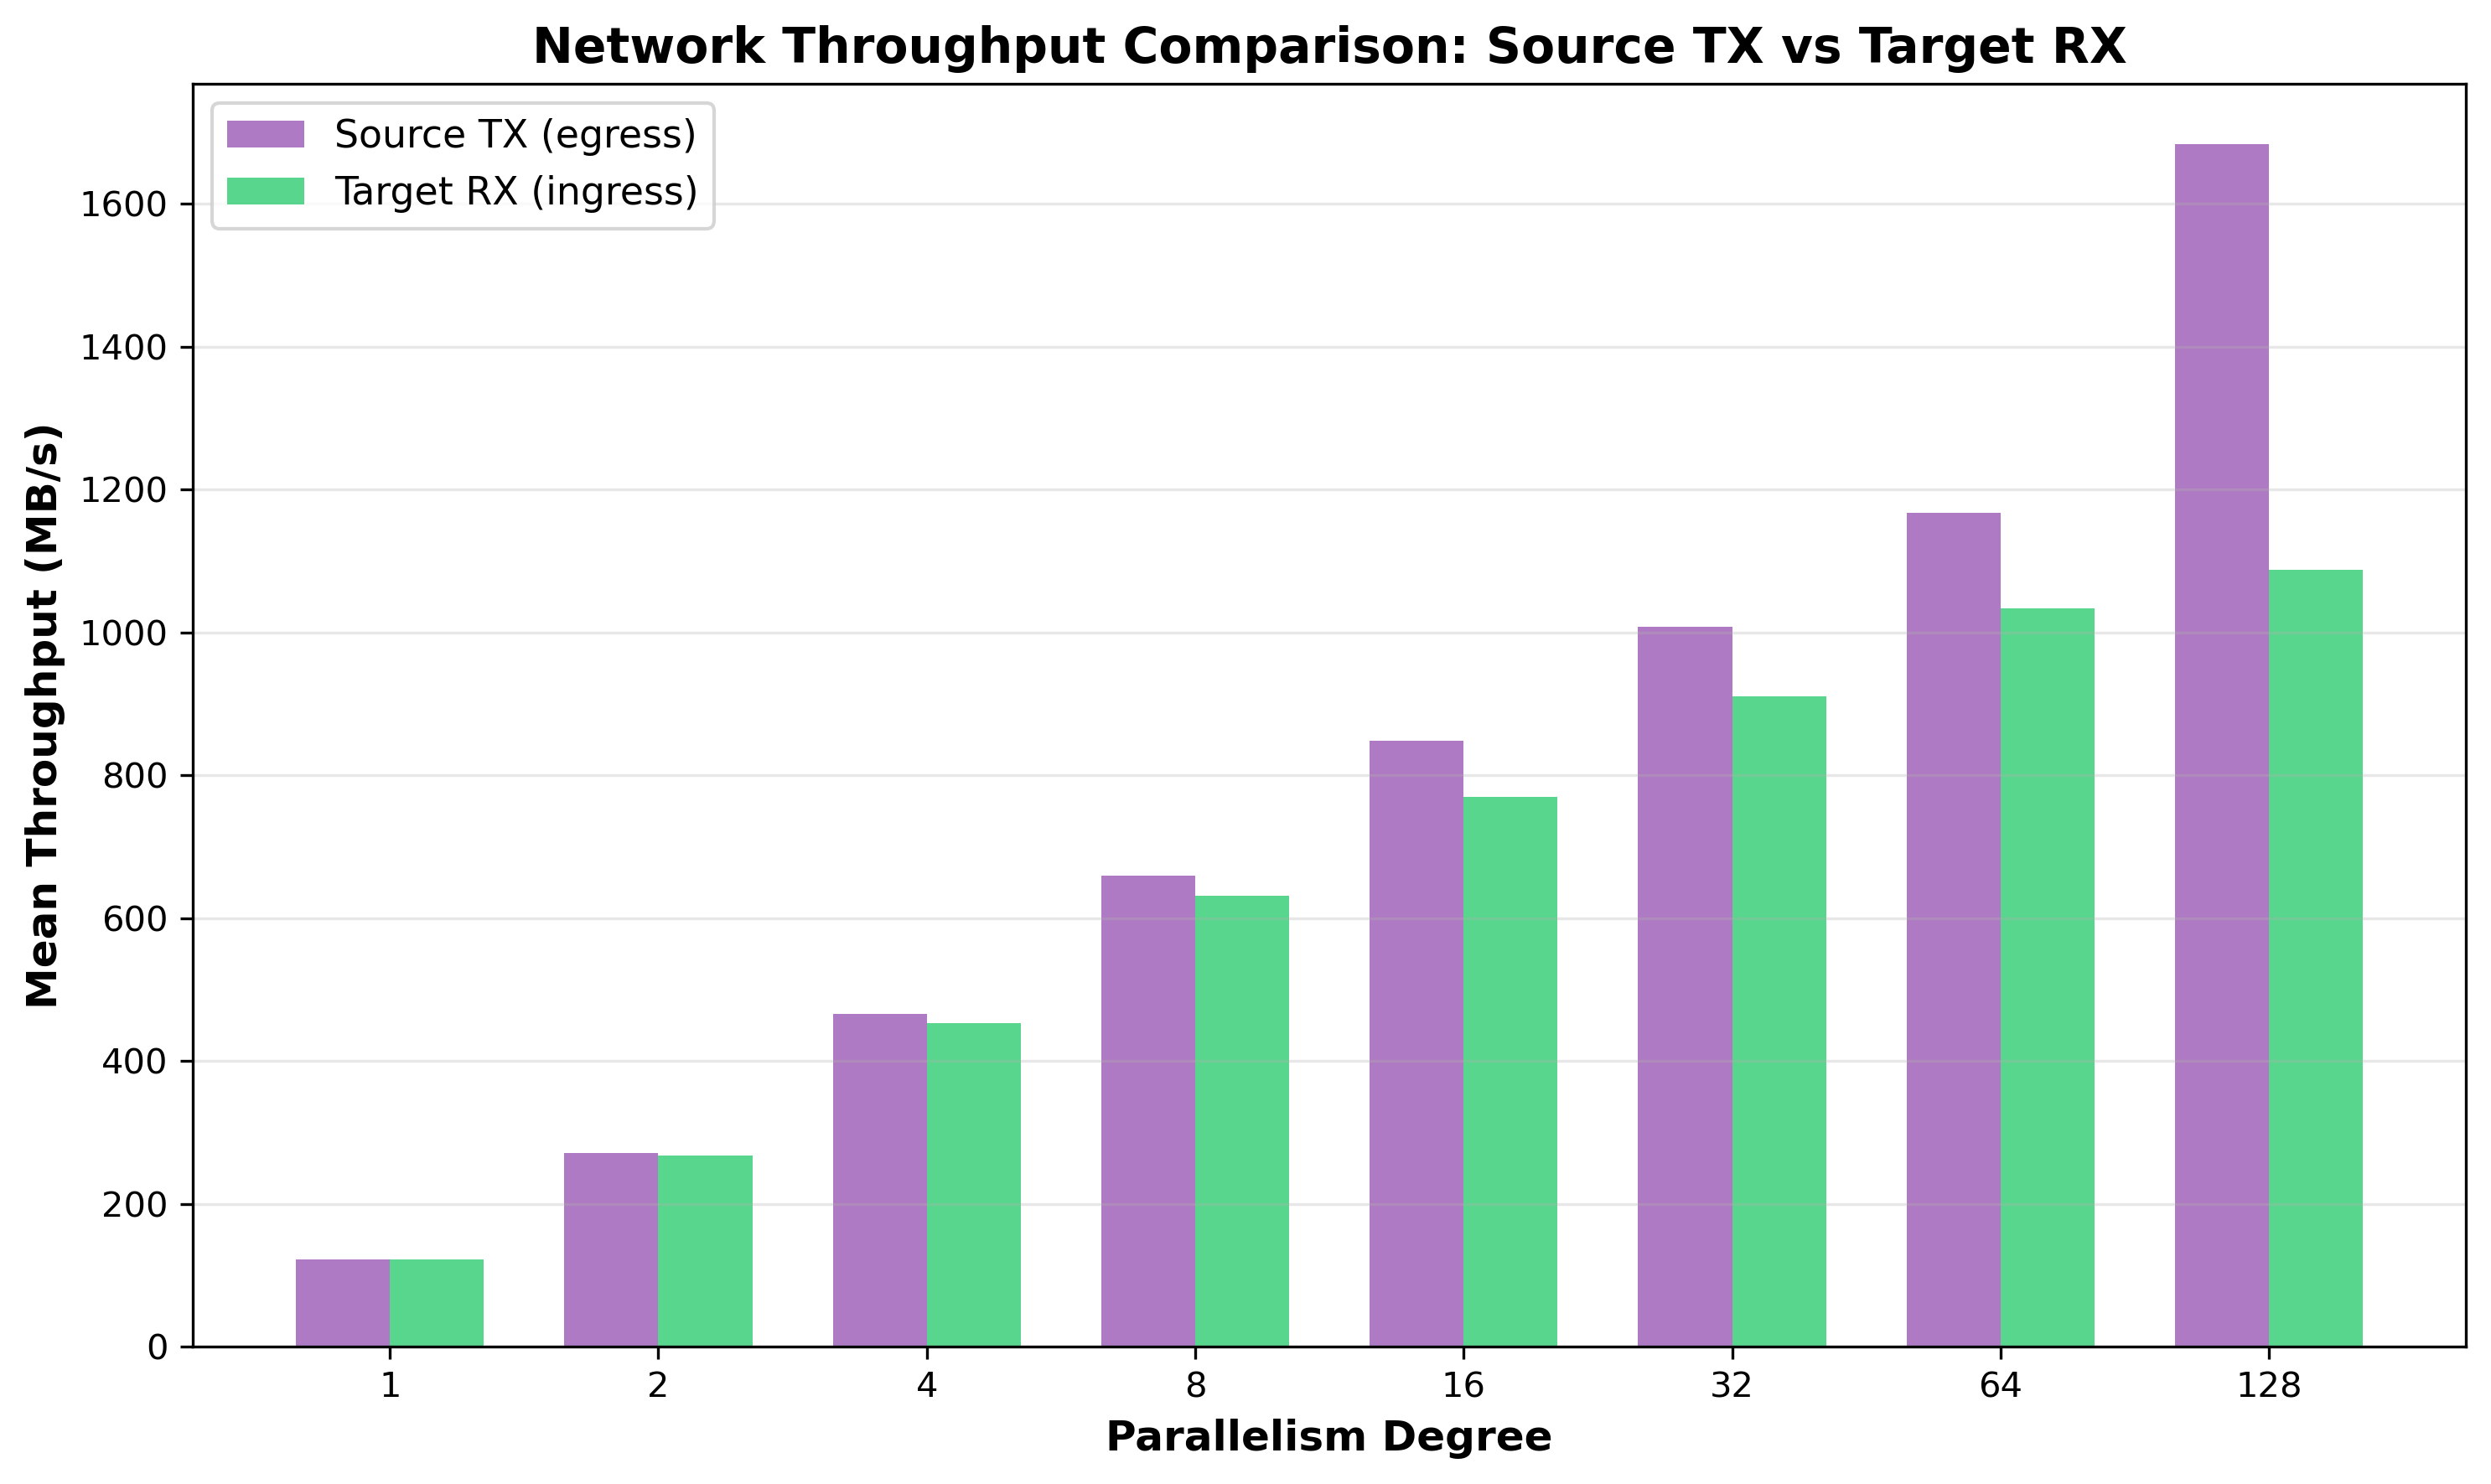
Figure 18: Network Throughput Comparison: Source TX vs Target RX - At degree 128, source transmits 1,684 MB/s while target receives only 1,088 MB/s, creating a 596 MB/s (35%) deficit. This suggests the target cannot keep pace with source data production, likely due to CPU lock contention.
The apparent 35% violation of flow conservation is explained by TCP retransmissions. The source TX counter (measured via sar -n DEV) counts both original packets and retransmitted packets, while the target RX counter only counts successfully received unique packets. When the target is overloaded with CPU lock contention (83.9% system CPU at degree 64), it cannot drain receive buffers fast enough, causing packet drops that trigger TCP retransmissions. The 596 MB/s “deficit” is actually retransmitted data counted twice at the source but only once at the target, providing quantitative evidence of the target’s inability to keep pace with source data production.
5.5 I/O Analysis Conclusions
-
Disk does not appear to be the bottleneck: 24% average utilization at degree 128 with 76% idle capacity. PostgreSQL matches FIO peak (3,759 MB/s) but sustains only 170 MB/s average.
-
Network does not appear to be the bottleneck for degrees 1-64: Utilization remains below 42% through degree 64. Saturation occurs only at degree 128 during active bursts (~2,450 MB/s plateau).
-
Target CPU lock contention appears to be the root cause: Low disk utilization + network saturation only at degree 128 + poor scaling efficiency throughout + high system CPU percentage (83.9% at degree 64) all point to the same conclusion.
-
Backpressure suggests target bottleneck: Source can produce 1,684 MB/s but target can only consume 1,088 MB/s. Source processes use only 0.11 cores/process, suggesting they’re blocked waiting for target acknowledgments.
6. Conclusions
6.1 Performance Achievement and Bottleneck Analysis
FastTransfer successfully demonstrates strong absolute performance, achieving a 13.1x speedup that reduces 77GB transfer time from approximately 15 minutes (878s) to just over 1 minute (67s). This represents practical, production-ready performance with sustained throughput of 1.15 GB/s at degree 128. The system delivers continuous performance improvements across all tested parallelism degrees, confirming that parallel replication provides meaningful benefits even when facing coordination challenges.
The primary scaling limitation appears to be target PostgreSQL lock contention beyond degree 32. System CPU grows to 83.9% at degree 64, meaning only 16.2% of CPU performs productive work. Degree 128 continues to improve absolute performance (67s vs 92s) even as total CPU decreases from 4,596% to 4,230%, though the reason for this unexpected efficiency improvement remains unclear.
6.2 Why Additional Tuning should not Help
The target table is rather optimally configured (UNLOGGED, no indexes, no constraints, no triggers). PostgreSQL configuration includes all recommended bulk loading optimizations (80GB shared_buffers, huge pages, io_uring, fsync=off). Despite this, system CPU remains at 70-84% at high degrees.
The bottleneck appears to be more architectural than configurational, with bffer pool partition locks, relation extension lock, FSM access… No configuration parameter appears able to eliminate these fundamental coordination requirements.
6.3 Future Work: PostgreSQL Instrumentation Analysis
While this analysis relied on system-level metrics, a follow-up study will use PostgreSQL’s internal instrumentation to provide direct evidence of lock contention and wait events. This will validate the hypotheses presented in this analysis using database engine-level metrics.
Appendix A: PostgreSQL Configuration
Both PostgreSQL 18 instances were tuned for maximum bulk loading performance.
Target PostgreSQL Configuration (Key Settings)
# Memory allocation
shared_buffers = 80GB              # 31% of 256GB RAM
huge_pages = on                    # vm.nr_hugepages=45000
work_mem = 256MB
maintenance_work_mem = 16GB

# Durability disabled (benchmark only, NOT production)
synchronous_commit = off
fsync = off
full_page_writes = off

# WAL configuration (minimal for UNLOGGED)
wal_level = minimal
wal_buffers = 128MB
max_wal_size = 128GB
checkpoint_timeout = 15min
checkpoint_completion_target = 0.5

# Background writer (AGGRESSIVE)
bgwriter_delay = 10ms              # Down from default 200ms
bgwriter_lru_maxpages = 2000       # 2x default
bgwriter_lru_multiplier = 8.0      # 2x default
bgwriter_flush_after = 0

# I/O configuration (PostgreSQL 18 optimizations)
backend_flush_after = 0
effective_io_concurrency = 400     # Optimized for NVMe
maintenance_io_concurrency = 400
io_method = io_uring               # NEW PG18: async I/O
io_max_concurrency = 512           # NEW PG18
io_workers = 8                     # NEW PG18: up from default 3

# Worker processes
max_worker_processes = 128
max_parallel_workers = 128

# Autovacuum (PostgreSQL 18)
autovacuum = on
autovacuum_worker_slots = 32       # NEW PG18: runtime adjustment
autovacuum_max_workers = 16
autovacuum_vacuum_cost_delay = 0   # No throttling

# Query tuning
enable_partitionwise_join = on
enable_partitionwise_aggregate = on
random_page_cost = 1.1             # NVMe SSD
effective_cache_size = 192GB       # ~75% of RAM
Source PostgreSQL Configuration (Key Settings)
The source instance is optimized for fast parallel reads to support high-throughput data extraction:
# Memory allocation
shared_buffers = 80GB              # ~31% of 256GB RAM
huge_pages = on                    # vm.nr_hugepages=45000
work_mem = 256MB
maintenance_work_mem = 4GB         # Lower than target (16GB)

# Durability disabled (benchmark only, NOT production)
synchronous_commit = off
fsync = off
full_page_writes = off

# WAL configuration
wal_level = minimal
wal_buffers = -1                   # Auto-sized
max_wal_size = 32GB                # Smaller than target (128GB)
checkpoint_timeout = 60min         # Longer than target (15min)
checkpoint_completion_target = 0.9

# Background writer
bgwriter_delay = 50ms              # Less aggressive than target (10ms)
bgwriter_lru_maxpages = 1000       # Half of target (2000)
bgwriter_lru_multiplier = 4.0      # Half of target (8.0)
bgwriter_flush_after = 2MB

# I/O configuration (PostgreSQL 18 optimizations)
backend_flush_after = 0
effective_io_concurrency = 400     # Identical to target
maintenance_io_concurrency = 400
io_method = io_uring               # NEW PG18: async I/O
io_max_concurrency = 512           # NEW PG18
io_workers = 8                     # NEW PG18

# Worker processes
max_connections = 500              # Higher than target for parallel readers
max_worker_processes = 128
max_parallel_workers_per_gather = 64
max_parallel_workers = 128

# Query tuning (optimized for parallel reads)
enable_partitionwise_join = on
enable_partitionwise_aggregate = on
random_page_cost = 1.1             # Block Storage (not NVMe)
effective_cache_size = 192GB       # ~75% of RAM
default_statistics_target = 500

# Autovacuum (PostgreSQL 18)
autovacuum = on
autovacuum_worker_slots = 32       # NEW PG18: runtime adjustment
autovacuum_max_workers = 16
autovacuum_vacuum_cost_delay = 0   # No throttling
Table Configuration
The target table eliminates all overhead sources:
- UNLOGGED: No WAL write, flush, or archival overhead
- No indexes: Eliminates 50-80% of bulk load cost
- No primary key: No index maintenance or uniqueness checking
- No constraints: No foreign key, check, or unique validation
- No triggers: No trigger execution overhead
This represents the absolute minimum overhead possible.
About FastTransfer
FastTransfer is a commercial high-performance data migration tool developed by arpe.io. It provides parallel data transfer capabilities across multiple database platforms including PostgreSQL, MySQL, Oracle, SQL Server, ClickHouse, and DuckDB.
Key Features:
- Advanced parallelization strategies for optimal performance
- Cross-platform compatibility with major databases
- Flexible configuration for various data migration scenarios
- Production-ready with comprehensive logging and monitoring
For licensing information, support options, and to request a trial, visit the official documentation.