
Logging and Monitoring
MigratorXpress provides comprehensive logging through two complementary systems: database logging for structured migration tracking and file-based logging for detailed operational information.
Database Logging (SQL Server)
The migration tracking database uses SQL Server to maintain a complete audit trail of all migration activities. This structured approach enables reporting, monitoring, and troubleshooting across multiple migration runs.
Database Schema Overview
The migration database consists of several interconnected tables that track every aspect of the migration process:
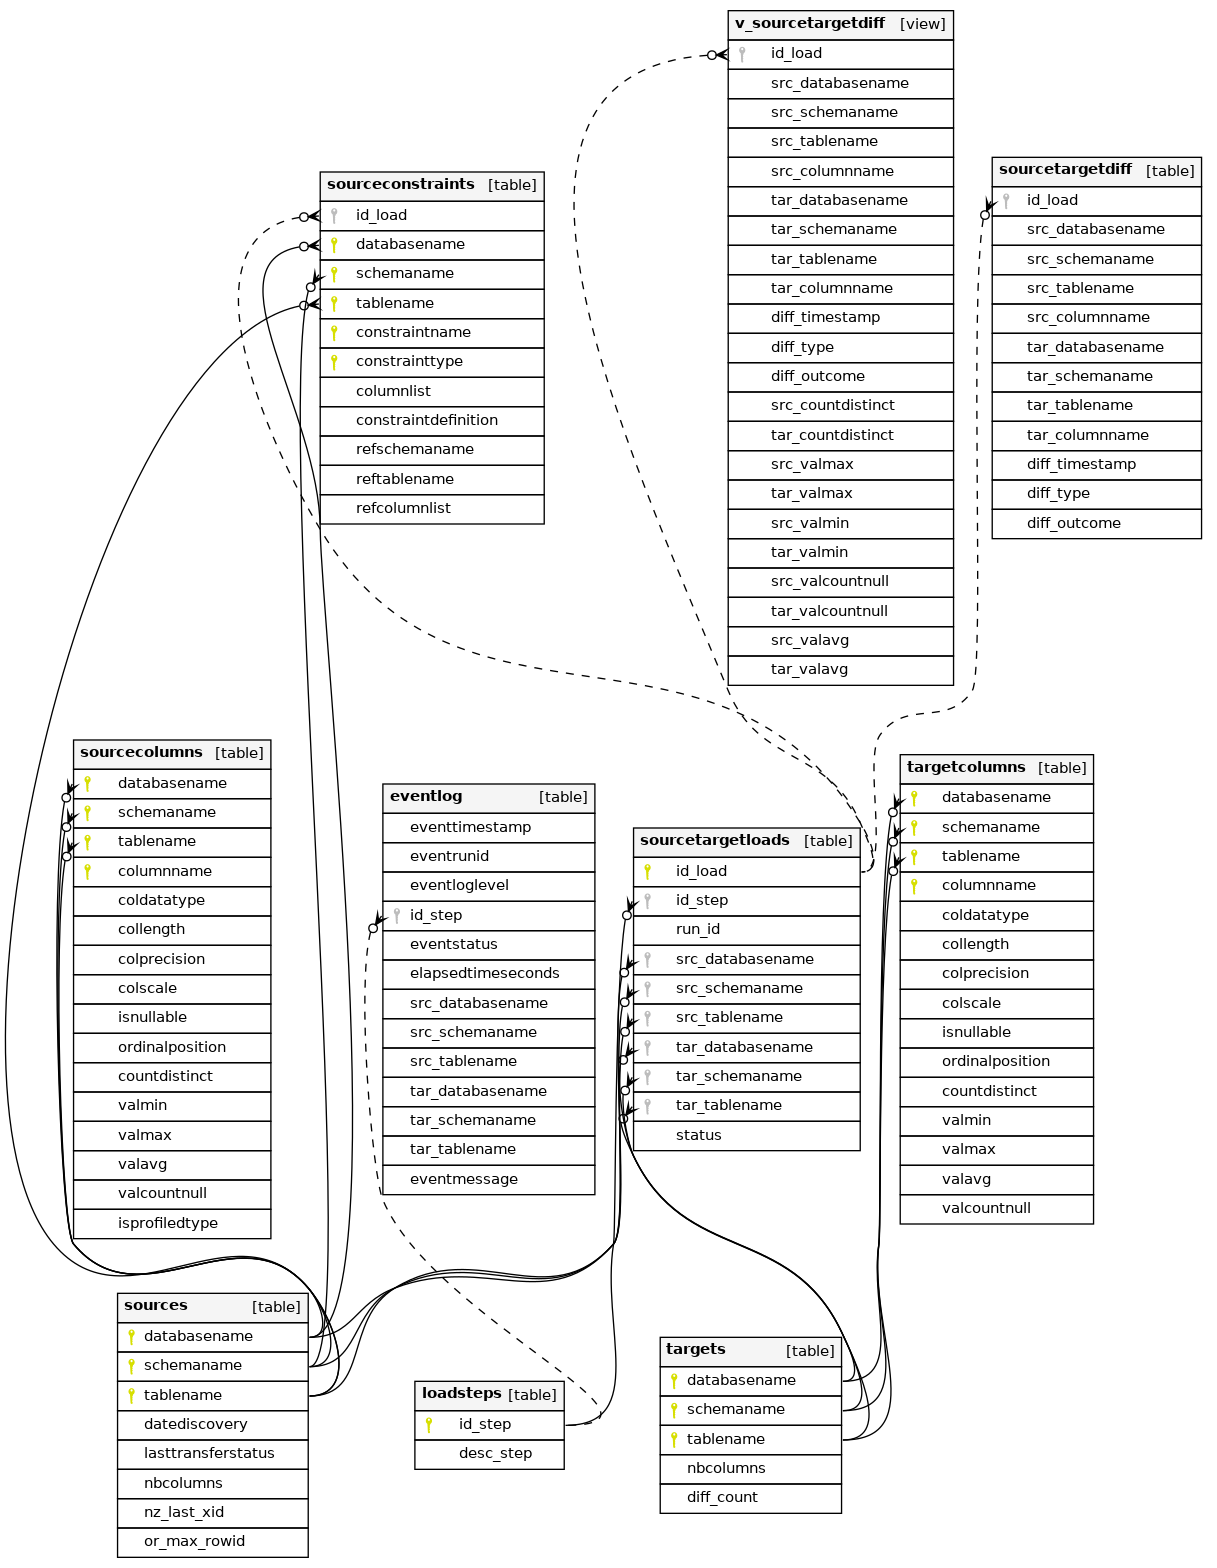
Key Tables
sources
Tracks all discovered source tables with metadata including:
- Row counts (exact and estimated)
- Column counts
- Discovery timestamp
- Last transfer status
- Platform-specific tracking (Netezza XID, Oracle ROWID)
targets
Mirrors the source table structure for target databases, including:
- Row counts for validation
- Column counts
- Diff counts from validation runs
sourcecolumns / targetcolumns
Detailed column-level metadata including:
- Data types and precision
- Nullability
- Statistical profiling (min, max, avg, distinct count)
- Ordinal position
sourcetargetloads
The core workflow tracking table that:
- Maps source tables to target tables
- Tracks migration steps (translate, create, transfer, diff, constraints)
- Associates work items with specific run IDs
- Records status for each operation
eventlog
Comprehensive event tracking with:
- Timestamp and duration for each operation
- Log levels (INFO, WARNING, ERROR)
- Detailed messages for troubleshooting
- Links to specific tables and migration steps
sourceconstraints
Captures all constraint definitions from source databases:
- Primary keys, foreign keys, unique constraints
- Column lists and definitions
- Referenced tables for foreign keys
File-Based Logging
Each MigratorXpress run creates a detailed log file with the naming pattern:
mig_YYYYMMDD_HHMMSS_<run_id>.log
Log Format
The log uses a structured format with timestamp, log level, process ID, and process name:
[YYYY-MM-DD HH:MM:SS.fff+TZ :: LEVEL :: PID :: ProcessName] Message
Sample Log Output
[2025-07-17 10:13:39.385+02:00 :: INFO :: 24172 :: MainProcess] Log file path: /home/francois/Workspace/MigratorXpress/mig_20250717_101339_f1a08f8a-62e5-11f0-8a5a-c403a82a4577.log
[2025-07-17 10:13:39.386+02:00 :: INFO :: 24172 :: MainProcess] **** discover source tables ****
[2025-07-17 10:13:39.386+02:00 :: INFO :: 24172 :: MainProcess] Fill the sources table in the migration database
[2025-07-17 10:13:39.435+02:00 :: INFO :: 24172 :: MainProcess] upserting 8 rows of the sources logDB table
[2025-07-17 10:13:39.548+02:00 :: INFO :: 24172 :: MainProcess] Extract and set data types for source database columns
[2025-07-17 10:13:39.718+02:00 :: INFO :: 24172 :: MainProcess] upserting 61 rows of the sourcecolumns logDB table
[2025-07-17 10:13:40.443+02:00 :: INFO :: 24172 :: MainProcess] Reset the number of rows for source database tables
[2025-07-17 10:13:40.525+02:00 :: INFO :: 24172 :: MainProcess] discover_source_tables         - Elapsed time (s) :      1.139
Log Levels
Use the --log_level to specify the level:
- INFO: Normal operational messages, progress indicators
- WARNING: Non-critical issues that don’t stop processing
- ERROR: Failures that prevent specific operations
- DEBUG: Detailed diagnostic information (when enabled)
- CRITICAL: Fatal errors that stop the entire migration
Log Location
By default, logs are created in the current working directory. Use the --log_dir parameter to specify a custom location:
./MigratorXpress --log_dir /var/log/migrations ...
Terminal Output
The same log information is displayed in the terminal during execution, allowing real-time monitoring of the migration progress.
Monitoring Best Practices
- Database Monitoring
- Set up alerts on the
eventlogtable for ERROR level events - Create dashboards showing migration progress by querying
sourcetargetloads - Monitor table-level success rates and timing
- Set up alerts on the
- File Log Analysis
- Use log aggregation tools for multi-server deployments
- Parse elapsed time entries to identify performance bottlenecks
- Archive logs with their corresponding run IDs for audit trails
- Performance Tracking
- Track elapsed times from
eventlog.elapsedtimeseconds - Compare source vs target row counts for validation
- Monitor FastTransfer performance for large tables
- Track elapsed times from
- Error Investigation
- Cross-reference file logs with database events using run_id
- Check
eventmessagefield for detailed error descriptions - Review the status progression in
sourcetargetloads
Integration with Monitoring Tools
The structured nature of both logging systems makes it easy to integrate with enterprise monitoring solutions:
- Database: Create views or stored procedures for monitoring dashboards
- Files: Use log shipping or parsing agents for centralized logging
- Alerts: Set up database triggers or log watchers for critical events